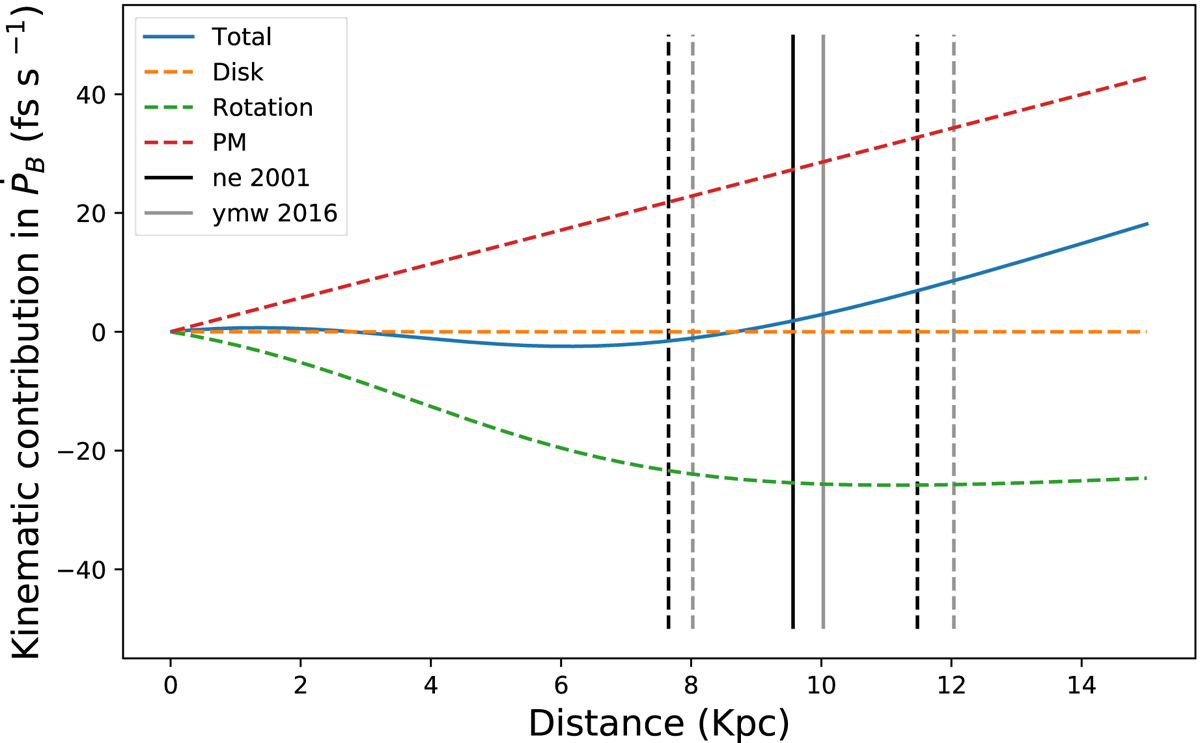
Fig. 3.
Download original image
Total kinematic contribution to the observed orbital decay, Ṗb,gal, shown as a function of distance to the pulsar in the blue curve. The red, orange, and green curves represent individual contributions due to galactic disk acceleration, galactic rotation (or differential) acceleration, and proper motion of the pulsar, respectively, with errors in R0 and θ0 providing negligible contributions. The vertical black line marks the DM distance from the NE2001 model. The 20% uncertainty in the model is shown as dashed black lines. Grey lines show an estimate of the DM distance from the YMW16 model. The maximum uncertainty in total kinematic contribution is 5.1 fs s−1.
Current usage metrics show cumulative count of Article Views (full-text article views including HTML views, PDF and ePub downloads, according to the available data) and Abstracts Views on Vision4Press platform.
Data correspond to usage on the plateform after 2015. The current usage metrics is available 48-96 hours after online publication and is updated daily on week days.
Initial download of the metrics may take a while.