Fig. 3
Download original image
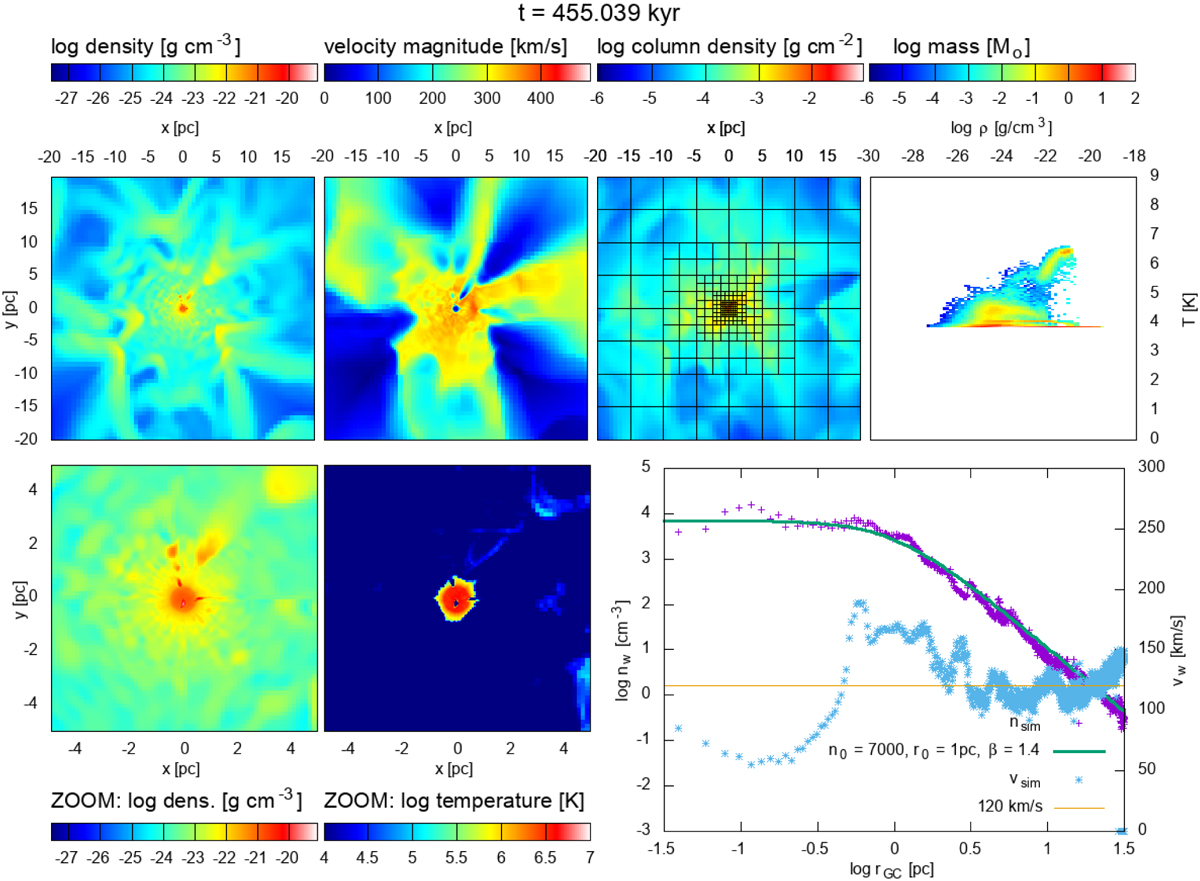
Hydrodynamic simulation of the nuclear star cluster wind at time 455 kyr (end of the simulated evolution). The top panels show (from left to right) the logarithm of the gas volume density, the magnitude of the gas velocity, the logarithm of the gas column density, and the gas density-temperature phase diagram, where the colour denotes the gas mass in a given bin. No gas has a temperature below 104 K since we did not allow the gas to cool below this limit. The volume density and velocity are plotted at plane z = 0, and the column density is integrated along the z-direction. The left two bottom panels show logarithms of the gas volume density and temperature in the central region. The bottom right panel shows radial profiles of the gas density and velocity integrated over axial directions (plus and asterisk, respectively). The solid lines show the fits to these quantities used in the paper.
Current usage metrics show cumulative count of Article Views (full-text article views including HTML views, PDF and ePub downloads, according to the available data) and Abstracts Views on Vision4Press platform.
Data correspond to usage on the plateform after 2015. The current usage metrics is available 48-96 hours after online publication and is updated daily on week days.
Initial download of the metrics may take a while.