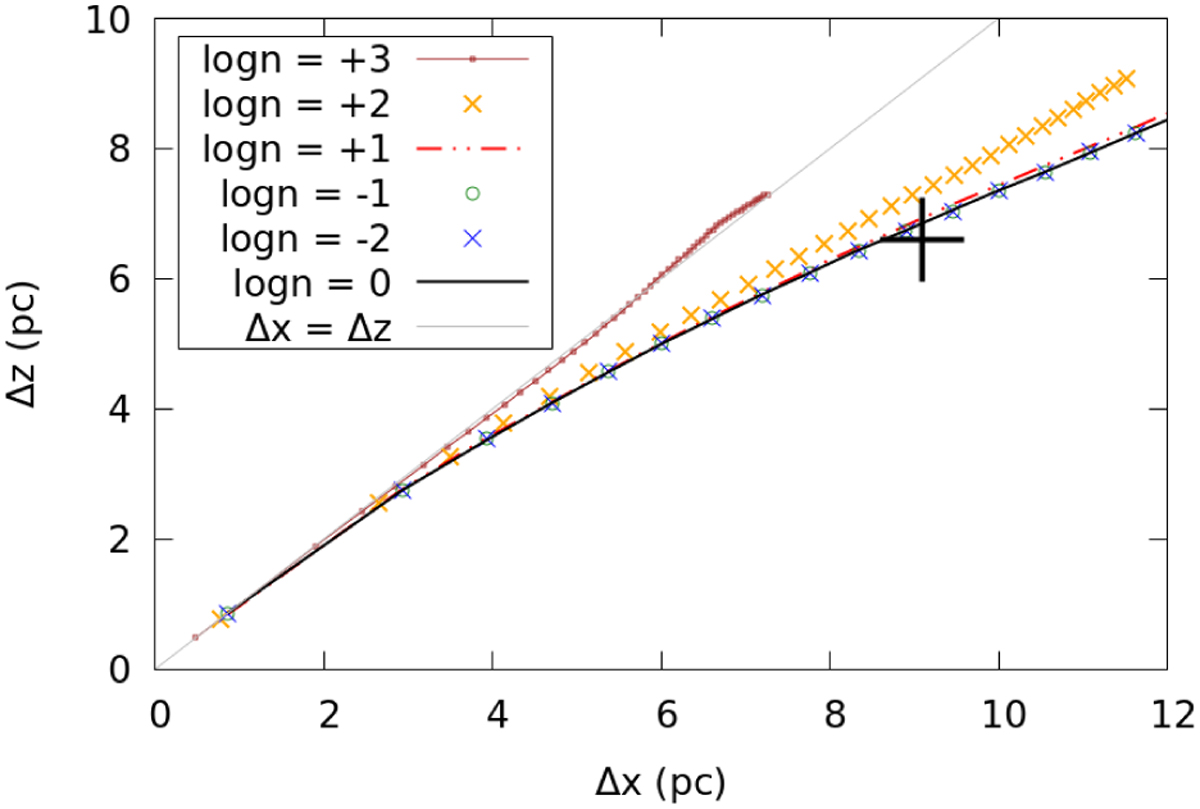
Fig. B.1
Download original image
Evolution of dimensions (∆x, ∆z) of the supernova remnant evolving into the ISM composed of the molecular cloud (with the position and size derived by the model A) and the young nuclear cluster wind, with the homogeneous background with a varying density. The solid black line corresponds to the density of 1 cm−3 (the standard case). Green and blue symbols correspond to lower densities (0.1 and 0.01 cm−3, respectively). The dashed red line and yellow crosses belong to higher densities (10 and 100 cm−3). The brown line with squares corresponds to the case of 1000 cm−3. Symbols, if present, are plotted each 1 kyr. The grey line is ∆x = ∆z, and the black cross shows the observed dimensions of Sgr A East.
Current usage metrics show cumulative count of Article Views (full-text article views including HTML views, PDF and ePub downloads, according to the available data) and Abstracts Views on Vision4Press platform.
Data correspond to usage on the plateform after 2015. The current usage metrics is available 48-96 hours after online publication and is updated daily on week days.
Initial download of the metrics may take a while.