Fig. 9.
Download original image
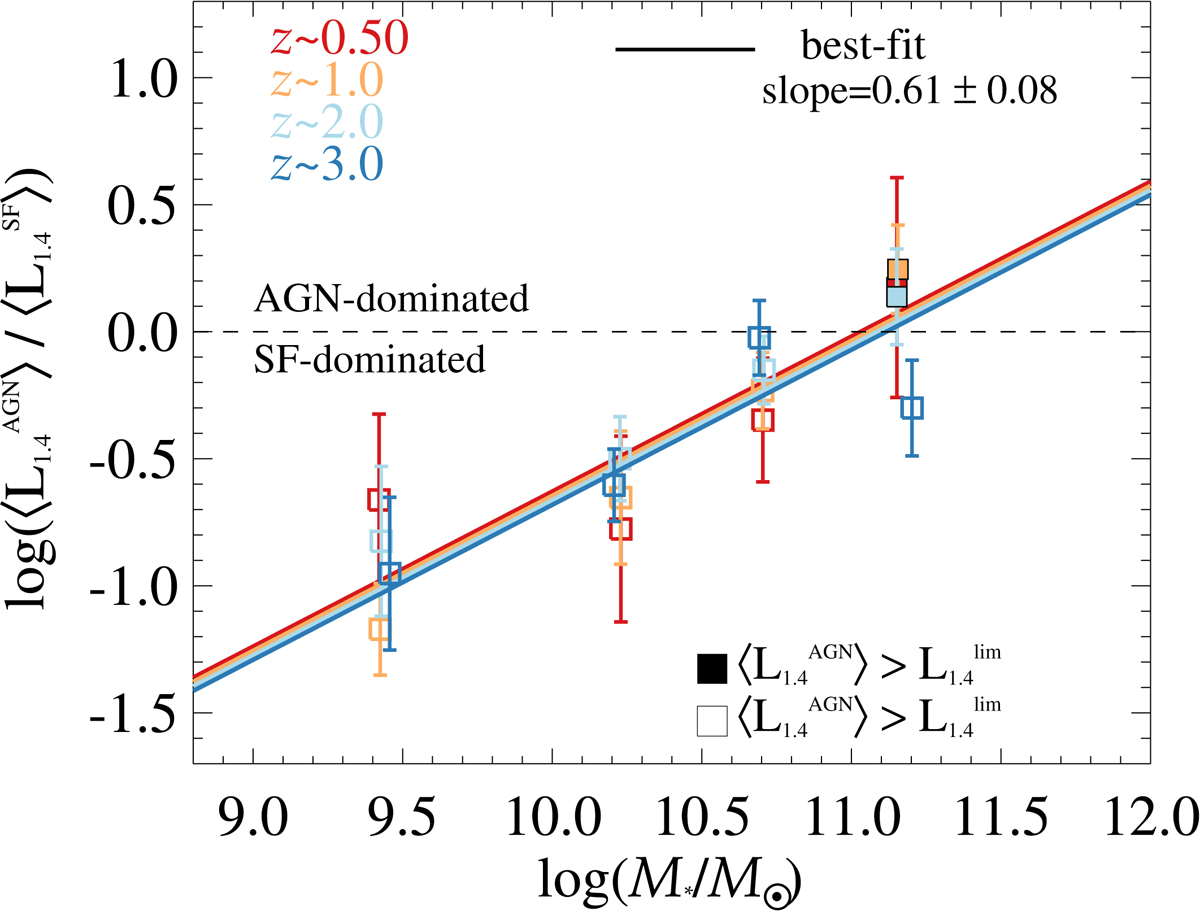
Logarithmic ratio between AGN-related and SF-related radio emission (![]() and
and ![]() , respectively), as a function of ℳ*, coloured by redshift. Each data point (square) represents the ratio between average AGN and SF luminosities for ℳ*-selected SFGs in the same bin. The dividing threshold between AGN and SF-dominated regions (dashed black line) is crossed at ℳ* ∼ 1011 ℳ⊙, above which galaxy radio emission is mainly powered by AGN jets. Filled squares mark bins in which the mean
, respectively), as a function of ℳ*, coloured by redshift. Each data point (square) represents the ratio between average AGN and SF luminosities for ℳ*-selected SFGs in the same bin. The dividing threshold between AGN and SF-dominated regions (dashed black line) is crossed at ℳ* ∼ 1011 ℳ⊙, above which galaxy radio emission is mainly powered by AGN jets. Filled squares mark bins in which the mean ![]() is above the 5σ VLA 3 GHz luminosity limit (
is above the 5σ VLA 3 GHz luminosity limit (![]() , scaled to 1.4 GHz). Coloured lines indicate the best-fit ratio (solid) from Eq. (10).
, scaled to 1.4 GHz). Coloured lines indicate the best-fit ratio (solid) from Eq. (10).
Current usage metrics show cumulative count of Article Views (full-text article views including HTML views, PDF and ePub downloads, according to the available data) and Abstracts Views on Vision4Press platform.
Data correspond to usage on the plateform after 2015. The current usage metrics is available 48-96 hours after online publication and is updated daily on week days.
Initial download of the metrics may take a while.