Fig. 7.
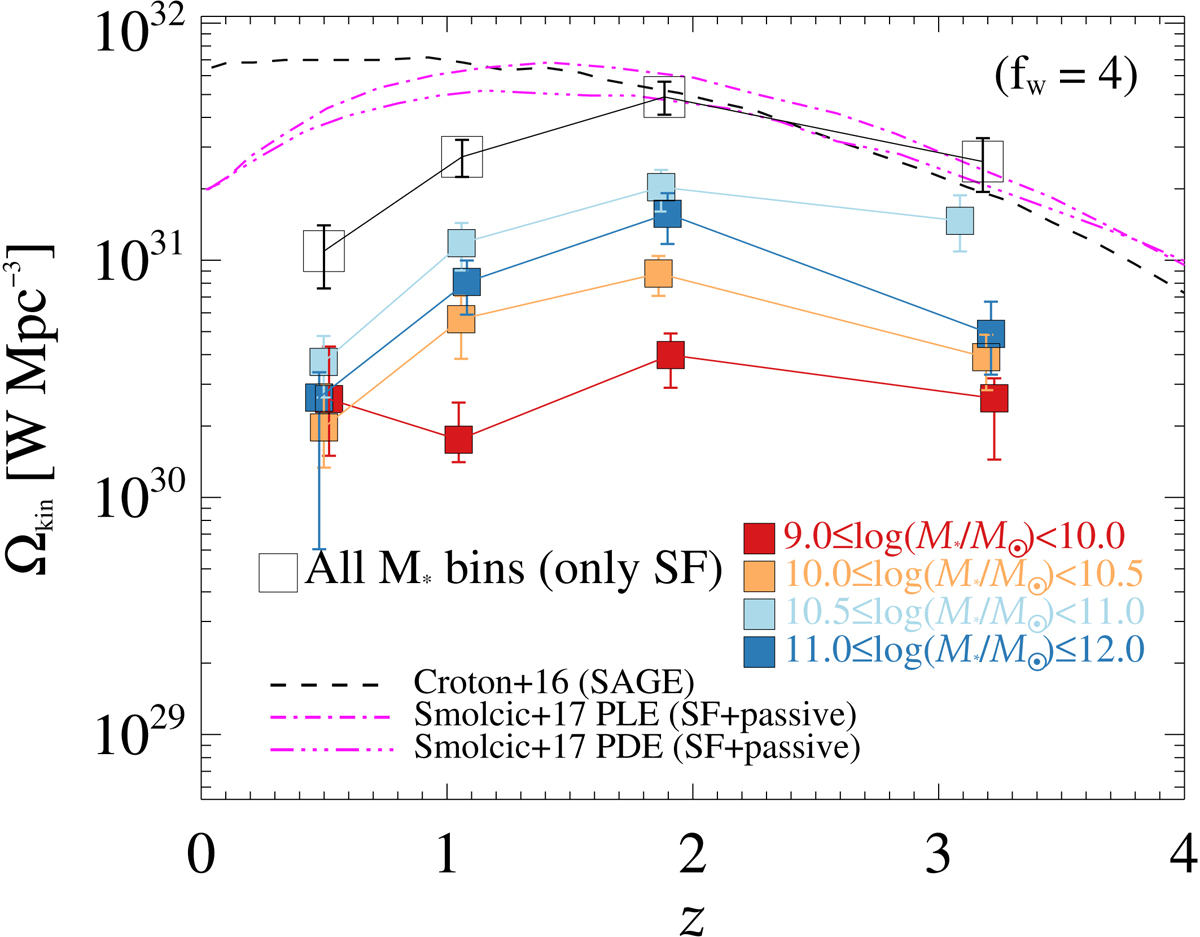
Download original image
Kinetic AGN luminosity density, Ωkin, as a function of redshift and dissected in ℳ* bins (coloured squares). The sum across all ℳ* at each redshift is marked with black open squares. For comparison, we show the integrated values from Smolčić et al. (2017c, purple lines), both for PLE (dot-dashed) and for PDE (triple dot-dashed) fitting forms. Model predictions from SAGE (Croton et al. 2016), including radio-mode AGN feedback, are displayed as a function of redshift (dashed black line). We assume fW = 4 as in Smolčić et al. (2017c) for consistency. See Sect. 5.1 for further details.
Current usage metrics show cumulative count of Article Views (full-text article views including HTML views, PDF and ePub downloads, according to the available data) and Abstracts Views on Vision4Press platform.
Data correspond to usage on the plateform after 2015. The current usage metrics is available 48-96 hours after online publication and is updated daily on week days.
Initial download of the metrics may take a while.