Fig. 3.
Download original image
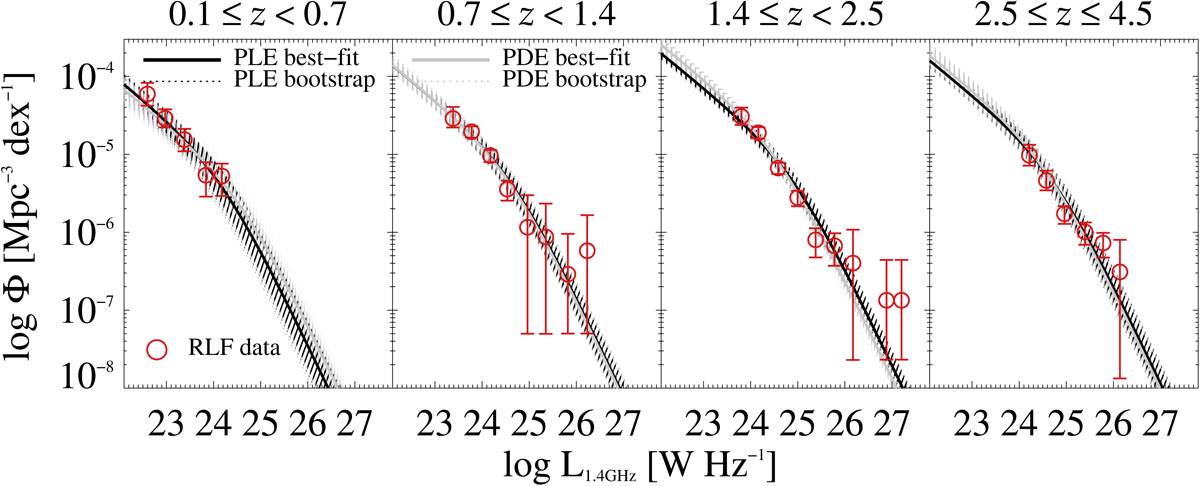
Observed AGN RLF (red circles) fitted in each redshift bin with two parametrisations: PLE (black lines) and PDE (grey lines). The corresponding best-fitting function obtained through MCMC using the analytical form of Mauch & Sadler (2007) is marked with a solid line. The 1000 bootstrapped RLFs (dotted lines) delimit the ±1σ confidence interval on the fit in each redshift bin. Further details are given in Sect. 4.2, and best-fit parameters and uncertainties are listed in Table 2.
Current usage metrics show cumulative count of Article Views (full-text article views including HTML views, PDF and ePub downloads, according to the available data) and Abstracts Views on Vision4Press platform.
Data correspond to usage on the plateform after 2015. The current usage metrics is available 48-96 hours after online publication and is updated daily on week days.
Initial download of the metrics may take a while.