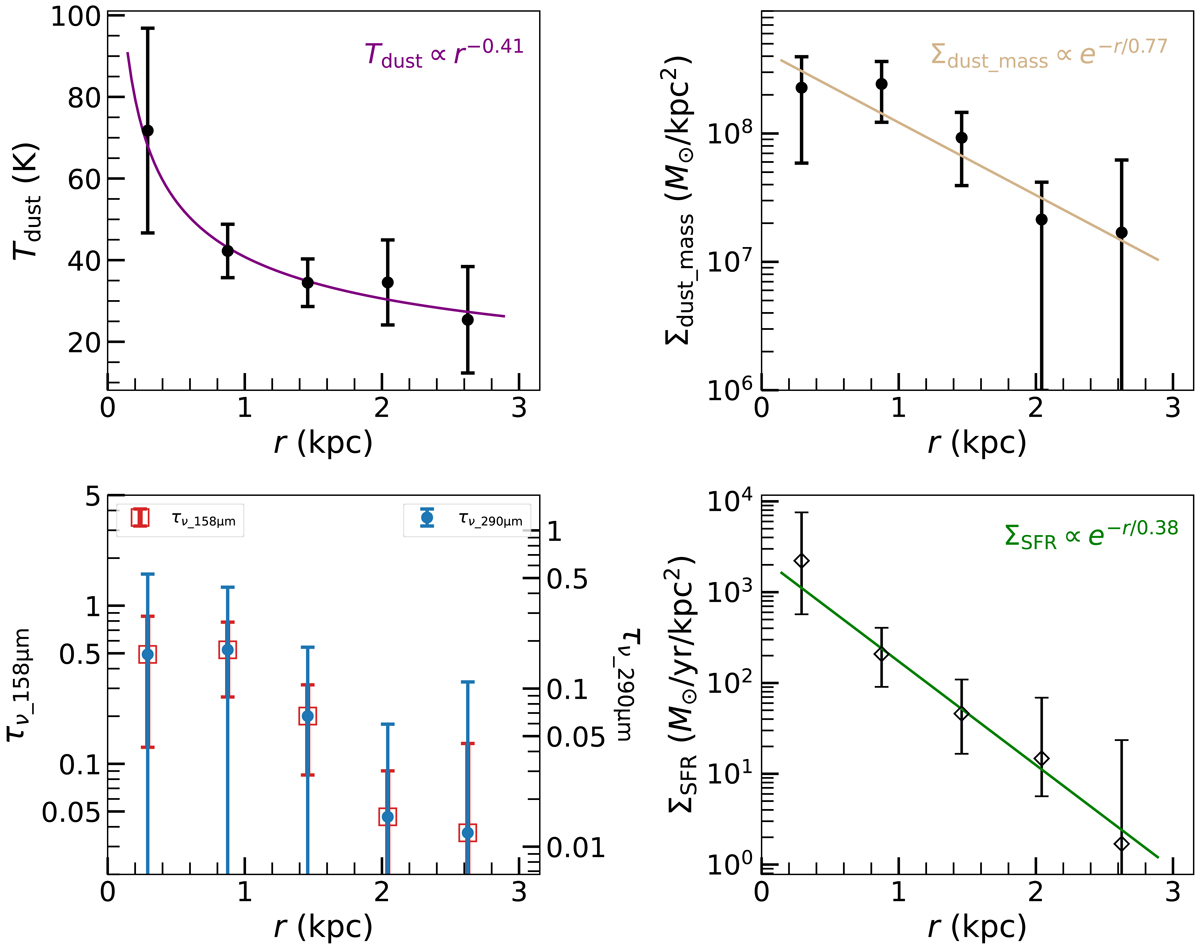
Fig. 9.
Download original image
Radial distributions of the dust temperature (top left), dust mass surface density (top right), optical depth (bottom left) at [C II] and CO (9–8) underlying dust continuum frequencies (red dots and blue squares with error bars, respectively), and the SFR surface density (bottom right). The purple, gold, and green lines are best-fit lines. Note that the uncertainties of the optical depth at different wavelengths are same in the bottom-left panel but appear different due to different ranges of the left and right axes. The error bars of the SFR surface density (which is associated with the dust temperature and dust mass) in the bottom-right panel are measured with a Monte Carlo method: we calculate samples by changing the parameter values with random Gaussian draws centered on their best-fit values and deviated by their errors shown in the top-left and top-right panels, and the lower and upper values are taken as the 16th and 84th percentiles.
Current usage metrics show cumulative count of Article Views (full-text article views including HTML views, PDF and ePub downloads, according to the available data) and Abstracts Views on Vision4Press platform.
Data correspond to usage on the plateform after 2015. The current usage metrics is available 48-96 hours after online publication and is updated daily on week days.
Initial download of the metrics may take a while.