Fig. 8.
Download original image
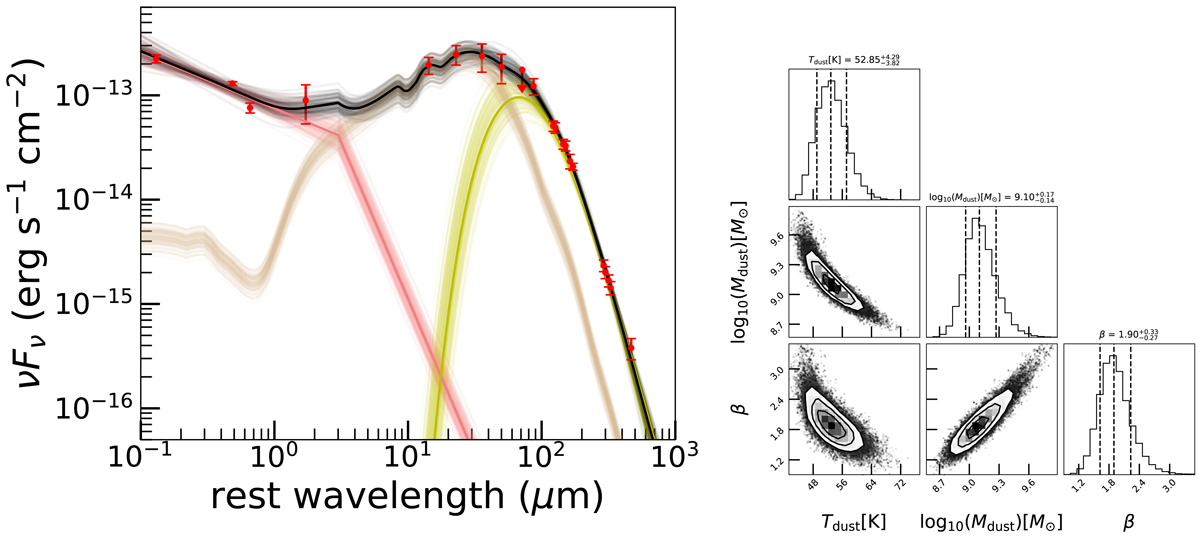
SED decomposition toward J2310+1855. Left panel: rest-frame UV-to-FIR SED fitting. The red points with error bars or downward arrows are observed data (see Table 3 in Shao et al. 2019 for details). The pink lines represent the UV/optical power law from the accretion disk. The brown lines correspond to the CAT3D AGN torus model (Hönig & Kishimoto 2017). The physical properties derived for these two components are detailed in Table 4 in Shao et al. (2019). The green lines correspond to a gray-body profile (Eqs. (1) and (2)) associated with star formation activity in the quasar host galaxy. The black lines are the sum of all components. The fit employed the MCMC method with the emcee package (Foreman-Mackey et al. 2013). We visualized the model uncertainties with shaded areas by randomly selecting 100 models from the parameter space. Right panel: corner map for the parameters (dust temperature, dust mass, and dust emissivity index) associated with the gray-body model for the FIR region SED fitting (green lines in the left panel). The contours are drawn at 1 − exp(−m2/2) (m = 0.5, 1, 1.5, 2) of the volume. The vertical dashed lines show 16th, 50th (median), and 84th percentiles.
Current usage metrics show cumulative count of Article Views (full-text article views including HTML views, PDF and ePub downloads, according to the available data) and Abstracts Views on Vision4Press platform.
Data correspond to usage on the plateform after 2015. The current usage metrics is available 48-96 hours after online publication and is updated daily on week days.
Initial download of the metrics may take a while.