Fig. 7.
Download original image
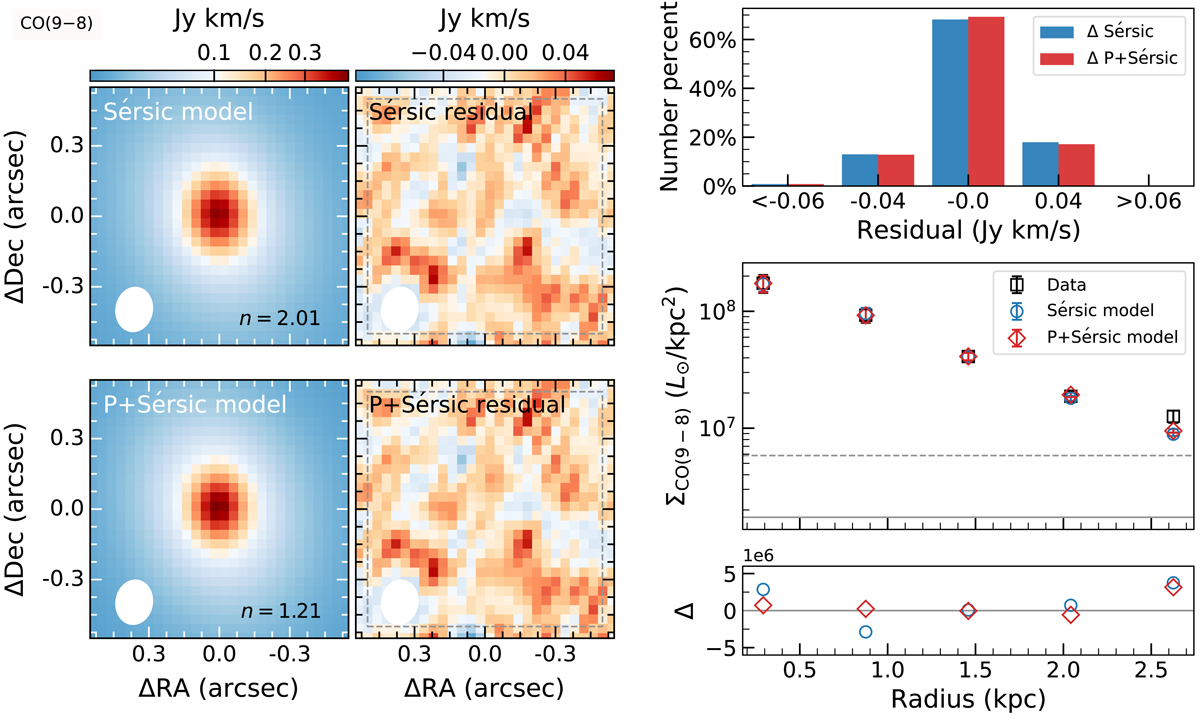
Image decomposition of the CO (9–8) line. Top-left panels: 2D elliptical Sérsic model and the residual between the observed and modeled CO (9–8) intensity maps, from left to right. We measured the residual rms inside the dashed gray square with a side length of 1″. Bottom-left panels: same as in the top panels but for the Point+2D elliptical Sérsic modeling. The peak values and rms within the dashed gray square are 0.061 and 0.021, and 0.059 and 0.020 Jy beam−1 km s−1 for the Sérsic and P+Sérsic residual maps, respectively. The shape of the CO (9–8) synthesized beam with a FWHM size of ![]() is plotted in the bottom-left corner of each panel. Top-right panel: distributions of the residuals for pixels inside the dashed gray squares (Sérsic modeling: blue histogram; P+Sérsic modeling: red histogram). Middle-right panel: CO (9–8) luminosity surface brightness (black squares, blue circles, and red diamonds with error bars are measurements from the observed intensity map, the 2D elliptical Sérsic model, and the Point+2D elliptical Sérsic model, respectively) at different radii, measured using elliptical rings with the ring width along the major axis half (
is plotted in the bottom-left corner of each panel. Top-right panel: distributions of the residuals for pixels inside the dashed gray squares (Sérsic modeling: blue histogram; P+Sérsic modeling: red histogram). Middle-right panel: CO (9–8) luminosity surface brightness (black squares, blue circles, and red diamonds with error bars are measurements from the observed intensity map, the 2D elliptical Sérsic model, and the Point+2D elliptical Sérsic model, respectively) at different radii, measured using elliptical rings with the ring width along the major axis half (![]() ) that of the CO (9–8) clean beam size, the rotation angle equal to
) that of the CO (9–8) clean beam size, the rotation angle equal to ![]() (=198°), and the ratio of semiminor and semimajor axis – b/a of
(=198°), and the ratio of semiminor and semimajor axis – b/a of ![]() (
(![]() ), where
), where ![]() and
and ![]() come from the CO (9–8) line kinematic modeling (listed in Table 3). The error bar represents the deviation of the values of all pixels in each ring. The solid and dashed gray lines are three times the CO (9–8) luminosity surface brightness limit measured in the emission-free region with an elliptical annulus that is the same with the ones used to measure the CO (9–8) luminosity surface brightness but has a larger radius, and its corresponding rms. Bottom-right panel: luminosity surface brightness difference between the measurements from the observed intensity map and the ones from the 2D elliptical Sérsic model (blue circles) and from the Point+2D elliptical Sérsic model (red diamonds). Note that the vertical scale is linear and in units of 106 L⊙ kpc−2.
come from the CO (9–8) line kinematic modeling (listed in Table 3). The error bar represents the deviation of the values of all pixels in each ring. The solid and dashed gray lines are three times the CO (9–8) luminosity surface brightness limit measured in the emission-free region with an elliptical annulus that is the same with the ones used to measure the CO (9–8) luminosity surface brightness but has a larger radius, and its corresponding rms. Bottom-right panel: luminosity surface brightness difference between the measurements from the observed intensity map and the ones from the 2D elliptical Sérsic model (blue circles) and from the Point+2D elliptical Sérsic model (red diamonds). Note that the vertical scale is linear and in units of 106 L⊙ kpc−2.
Current usage metrics show cumulative count of Article Views (full-text article views including HTML views, PDF and ePub downloads, according to the available data) and Abstracts Views on Vision4Press platform.
Data correspond to usage on the plateform after 2015. The current usage metrics is available 48-96 hours after online publication and is updated daily on week days.
Initial download of the metrics may take a while.