Fig. 5.
Download original image
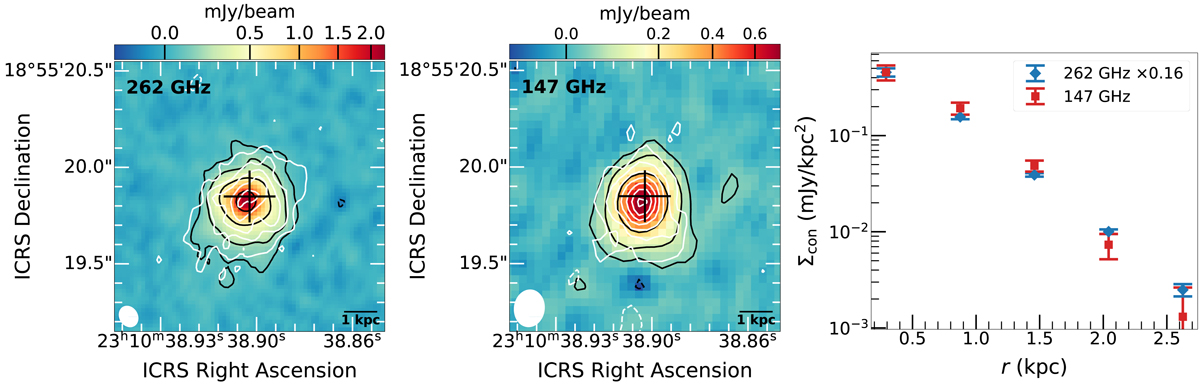
Dust continuum images at different frequencies and their radial profile comparison. Left and right panels: [C II] and CO (9–8) underlying dust continuum maps at 262 and 147 GHz, respectively. The black plus sign is the quasar position from HST snapshot observations. The bottom-left ellipse in each panel shows the restoring beam with FWHM sizes of ![]() ×
× ![]() and
and ![]() ×
× ![]() , respectively. The black contours are [−3, 3, 9, 27, 81] × rmscon for both maps. The rmscon at 262 and 147 GHz are 0.02 and 0.01 mJy beam−1, respectively. The overplotted white contours are from [C II] and CO (9–8) emission lines, and the contour levels are the same as those of the black contours in the left panels of Figs. 1 and 2. Right panel: comparison of the surface brightness of the continuum at two different frequencies. The blue and red symbols with error bars are for the scaled 262 and 147 GHz dust continuum, respectively. The error bar represents the deviation of the values of all pixels in each ring used to do the aperture photometry.
, respectively. The black contours are [−3, 3, 9, 27, 81] × rmscon for both maps. The rmscon at 262 and 147 GHz are 0.02 and 0.01 mJy beam−1, respectively. The overplotted white contours are from [C II] and CO (9–8) emission lines, and the contour levels are the same as those of the black contours in the left panels of Figs. 1 and 2. Right panel: comparison of the surface brightness of the continuum at two different frequencies. The blue and red symbols with error bars are for the scaled 262 and 147 GHz dust continuum, respectively. The error bar represents the deviation of the values of all pixels in each ring used to do the aperture photometry.
Current usage metrics show cumulative count of Article Views (full-text article views including HTML views, PDF and ePub downloads, according to the available data) and Abstracts Views on Vision4Press platform.
Data correspond to usage on the plateform after 2015. The current usage metrics is available 48-96 hours after online publication and is updated daily on week days.
Initial download of the metrics may take a while.