Fig. 3.
Download original image
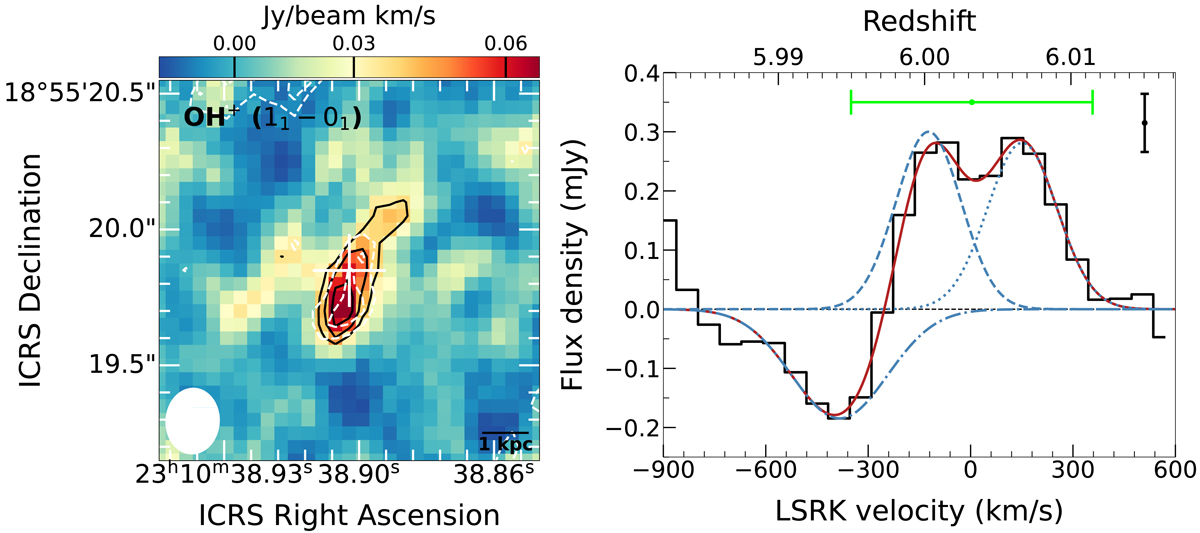
ALMA observed OH+ line. Left panel: OH+ emission line velocity-integrated map. The white plus sign is the HST quasar position. The shape of the restoring beam with a FWHM size of ![]() ×
× ![]() is plotted in the bottom-left corner. The contour levels in black are [3, 4, 5] × rmsOH+_em, where rmsOH+_em = 0.012 Jy beam−1 km s−1. The peak flux density is 0.066 ± 0.012 Jy beam−1 km s−1. The overplotted dashed white contours are from the OH+ absorption line, with contour levels of [−3, −2] × rmsOH+_ab, where rmsOH+_ab = 0.008 Jy beam−1 km s−1. Right panel: OH+ line spectrum (black histogram) overplotted with the best-fit triple-Gaussian profile (red line). The dashed and dotted blue lines present the blueward and redward emission components, respectively, and the dash-dotted blue line represent the absorption component. The spectrum is extracted from the 2σ region of the source emitting area in the OH+ intensity map. The LSRK velocity scale is relative to the [C II] redshift from our ALMA Cycle 0 observations (Wang et al. 2013). The spectral resolution is 31.25 MHz, corresponding to 64 km s−1. The rms of the spectrum is 0.05 mJy and is shown as a black bar. The green bar indicates the full width at zero intensity of the [C II] line, which is roughly consistent with that of the best-fit model for the OH+ emission line.
is plotted in the bottom-left corner. The contour levels in black are [3, 4, 5] × rmsOH+_em, where rmsOH+_em = 0.012 Jy beam−1 km s−1. The peak flux density is 0.066 ± 0.012 Jy beam−1 km s−1. The overplotted dashed white contours are from the OH+ absorption line, with contour levels of [−3, −2] × rmsOH+_ab, where rmsOH+_ab = 0.008 Jy beam−1 km s−1. Right panel: OH+ line spectrum (black histogram) overplotted with the best-fit triple-Gaussian profile (red line). The dashed and dotted blue lines present the blueward and redward emission components, respectively, and the dash-dotted blue line represent the absorption component. The spectrum is extracted from the 2σ region of the source emitting area in the OH+ intensity map. The LSRK velocity scale is relative to the [C II] redshift from our ALMA Cycle 0 observations (Wang et al. 2013). The spectral resolution is 31.25 MHz, corresponding to 64 km s−1. The rms of the spectrum is 0.05 mJy and is shown as a black bar. The green bar indicates the full width at zero intensity of the [C II] line, which is roughly consistent with that of the best-fit model for the OH+ emission line.
Current usage metrics show cumulative count of Article Views (full-text article views including HTML views, PDF and ePub downloads, according to the available data) and Abstracts Views on Vision4Press platform.
Data correspond to usage on the plateform after 2015. The current usage metrics is available 48-96 hours after online publication and is updated daily on week days.
Initial download of the metrics may take a while.