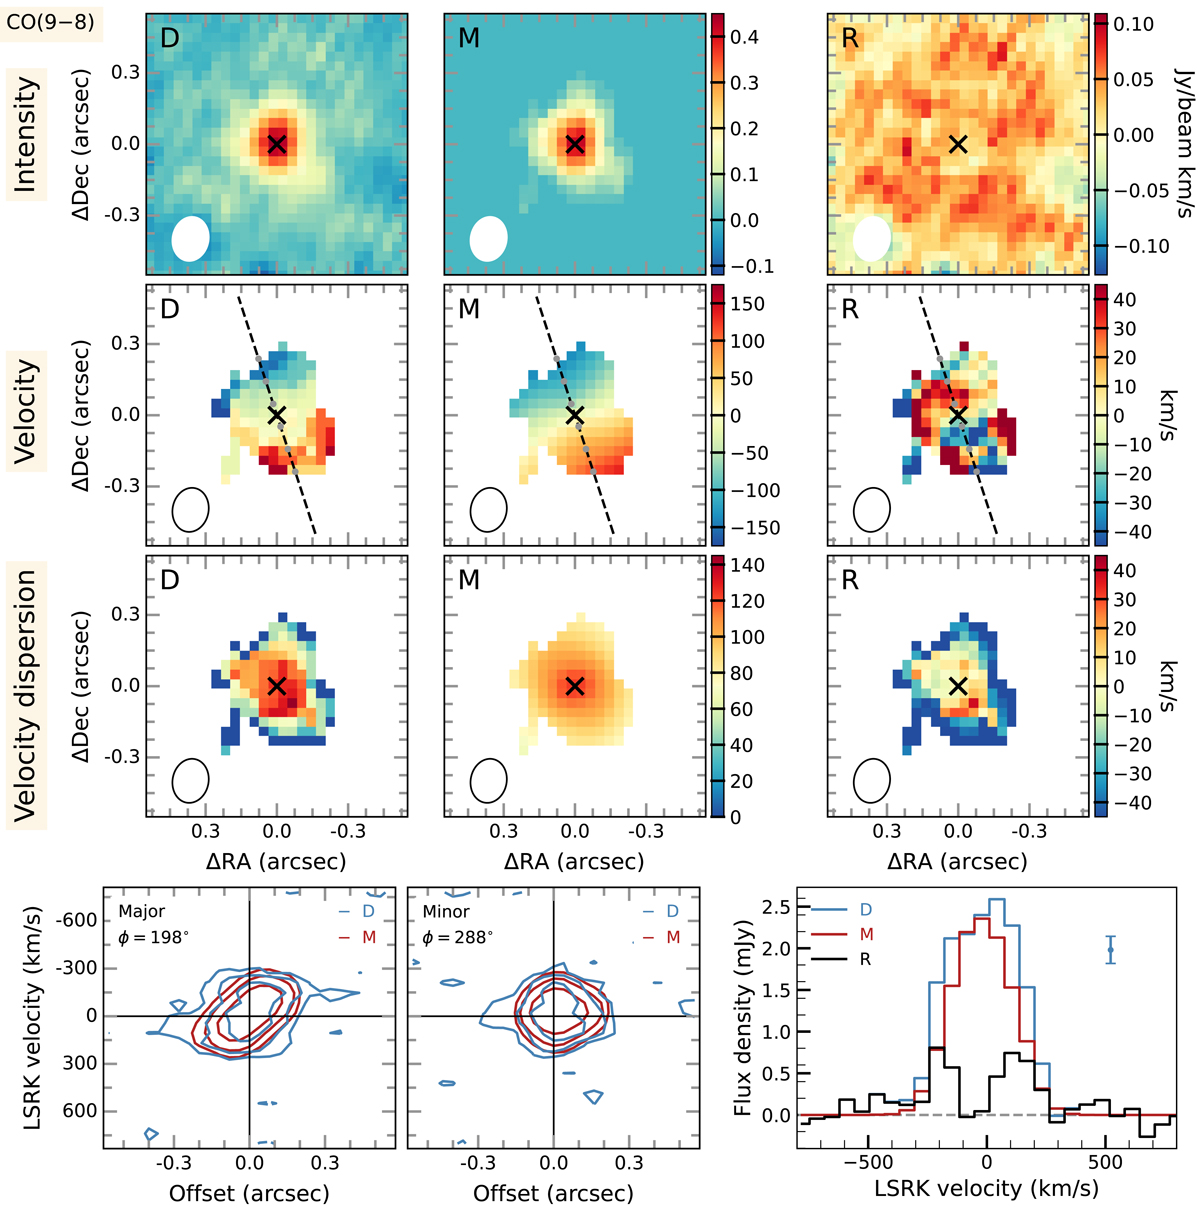
Fig. C.2.
Download original image
Similar to that of Fig. 10, but for the CO (9–8) line kinematic modeling. Upper panels – Shape of the synthesized beam with a FWHM size of ![]() is plotted in the bottom-left corner of each panel. Lower panels – Left and middle panels: Contour levels are [–2, 2, 4, 8, 16] × 0.093 mJy/beam for both the data and the model. Right panel: The spectral resolution is 31.25 MHz, corresponding to 64 km/s.
is plotted in the bottom-left corner of each panel. Lower panels – Left and middle panels: Contour levels are [–2, 2, 4, 8, 16] × 0.093 mJy/beam for both the data and the model. Right panel: The spectral resolution is 31.25 MHz, corresponding to 64 km/s.
Current usage metrics show cumulative count of Article Views (full-text article views including HTML views, PDF and ePub downloads, according to the available data) and Abstracts Views on Vision4Press platform.
Data correspond to usage on the plateform after 2015. The current usage metrics is available 48-96 hours after online publication and is updated daily on week days.
Initial download of the metrics may take a while.