Open Access
Fig. B.3.
Download original image
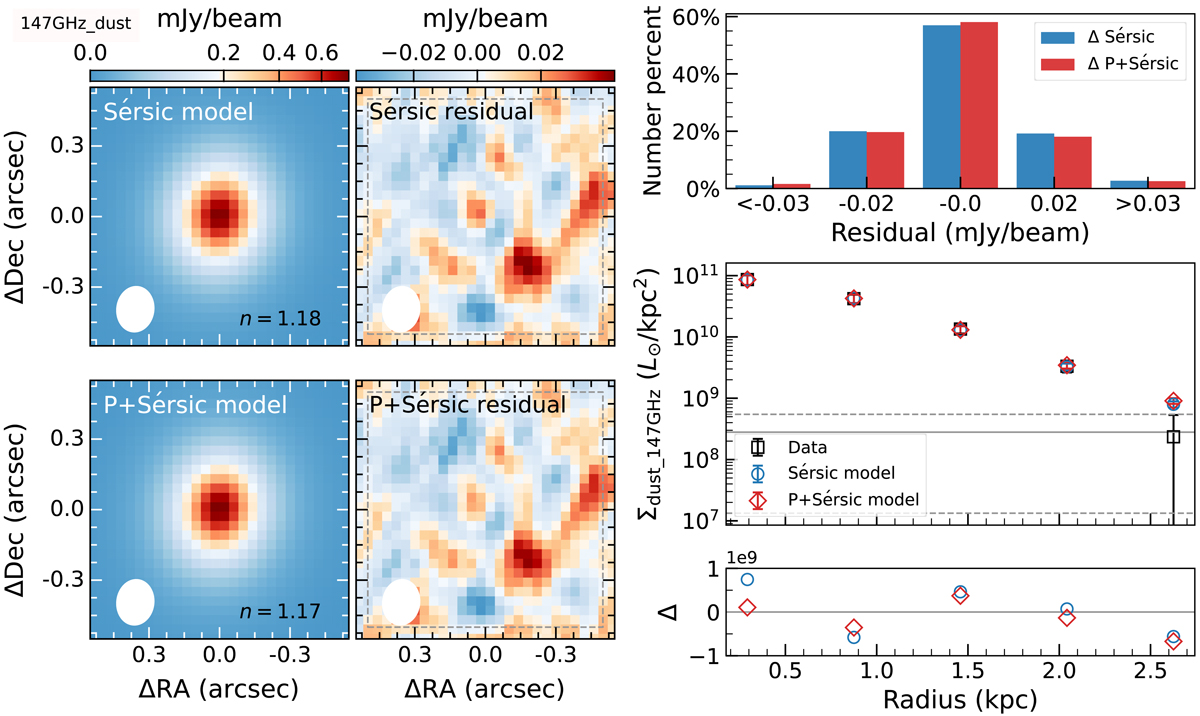
As in Fig. 7 but for the CO (9–8) underlying dust continuum. The peak values and rms within the dashed gray square are 0.043 and 0.014, and 0.041 and 0.014 Jy/beam km/s for the Sérsic and P+Sérsic residual maps, respectively. The shape of the synthesized beam with a FWHM size of ![]() is plotted as a white ellipse in each panel.
is plotted as a white ellipse in each panel.
Current usage metrics show cumulative count of Article Views (full-text article views including HTML views, PDF and ePub downloads, according to the available data) and Abstracts Views on Vision4Press platform.
Data correspond to usage on the plateform after 2015. The current usage metrics is available 48-96 hours after online publication and is updated daily on week days.
Initial download of the metrics may take a while.