Fig. B.2.
Download original image
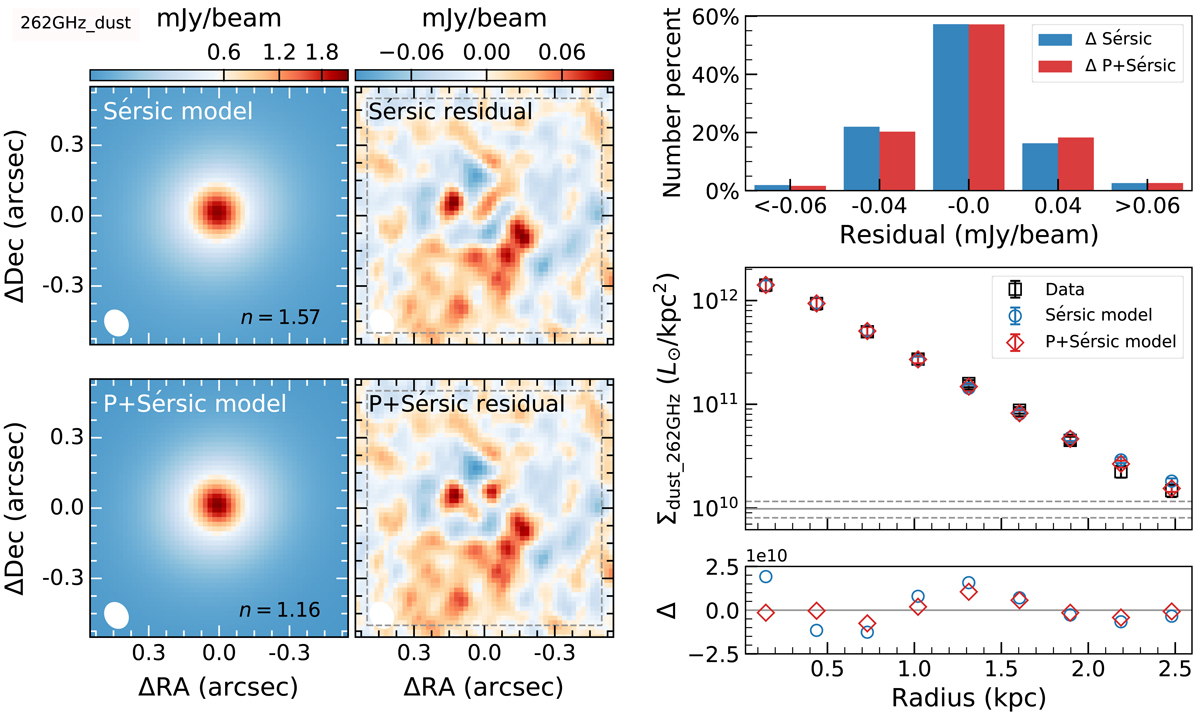
As in Fig. 7 but for the [C II] underlying dust continuum. The peak values and rms within the dashed gray square are 0.101 and 0.028, and 0.099 and 0.028 Jy/beam km/s for the Sérsic and P+Sérsic residual maps, respectively. The shape of the synthesized beam with a FWHM size of ![]() is plotted as white ellipses. We measured the [C II] underlying dust continuum luminosity surface density using elliptical rings with the ring width along the major axis of half (
is plotted as white ellipses. We measured the [C II] underlying dust continuum luminosity surface density using elliptical rings with the ring width along the major axis of half (![]() ) that of the major axis of the [C II] clean beam size, the rotation angle equal to
) that of the major axis of the [C II] clean beam size, the rotation angle equal to ![]() (=199°) and the ratio of semiminor and semimajor axis – b/a of
(=199°) and the ratio of semiminor and semimajor axis – b/a of ![]() (
(![]() ), where
), where ![]() and
and ![]() come from the [C II] line kinematic modeling (listed in Table 3).
come from the [C II] line kinematic modeling (listed in Table 3).
Current usage metrics show cumulative count of Article Views (full-text article views including HTML views, PDF and ePub downloads, according to the available data) and Abstracts Views on Vision4Press platform.
Data correspond to usage on the plateform after 2015. The current usage metrics is available 48-96 hours after online publication and is updated daily on week days.
Initial download of the metrics may take a while.