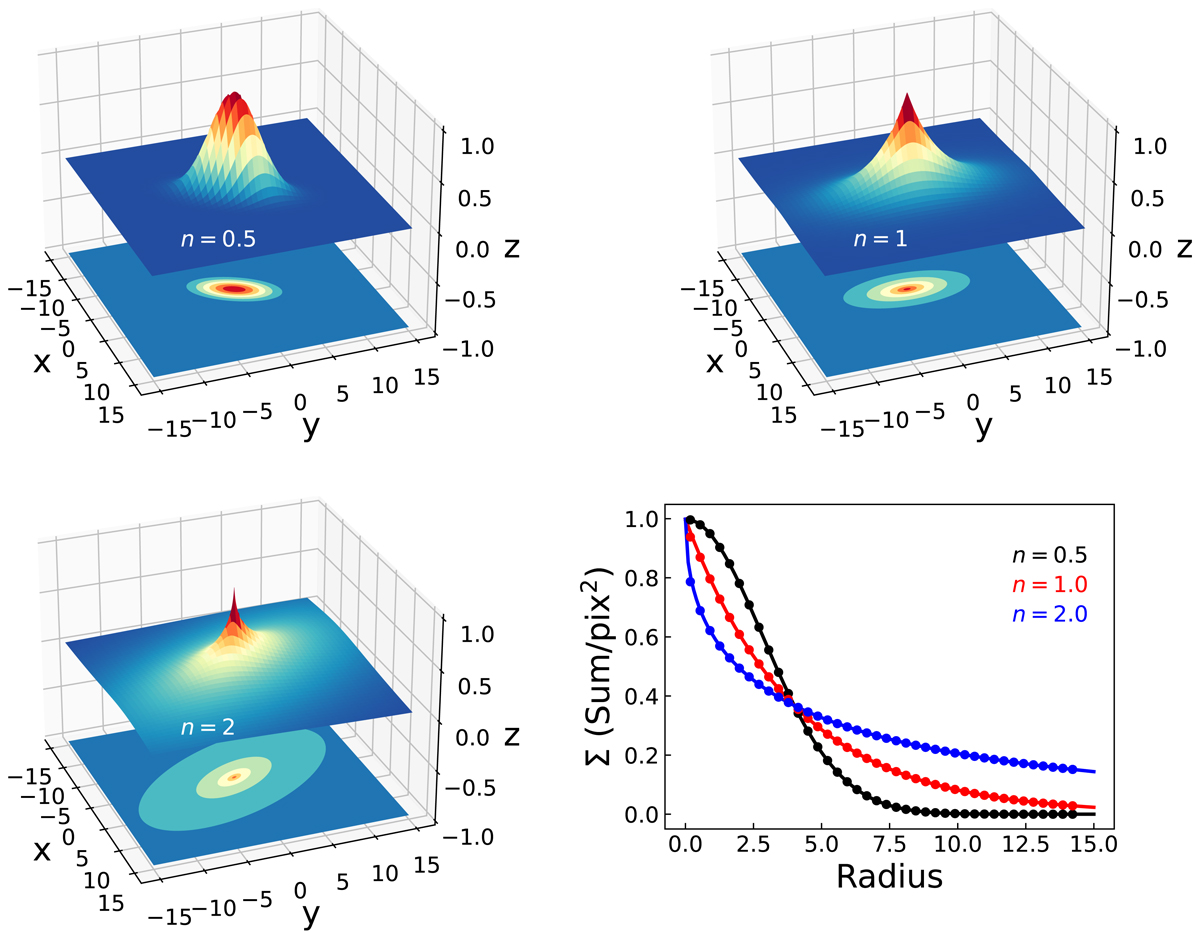
Fig. B.1.
Download original image
Surface plots, projected filled contour plots, and surface brightness distributions for 2D elliptical Sérsic images with (x0, y0) = (0, 0), hx = 4, and hy = 2. θ and n are π/3 and 0.5 (top left), π/2 and 1 (top right), 2π/3 and 2 (bottom left). The surface brightness as a function of radius shown in the bottom-right panel is measured using elliptical annuli with the same rotation angle of these images. The radius is the one along the major axis. The black, red and blue dots are measured from the top-left, top-right, and bottom-left images, respectively. The black, red, and blue lines are the fits to these surface brightness distributions with 1D Sérsic function in Eq. B.1. The best-fitted Sérsic indices are labeled in the same colors as the fitting lines.
Current usage metrics show cumulative count of Article Views (full-text article views including HTML views, PDF and ePub downloads, according to the available data) and Abstracts Views on Vision4Press platform.
Data correspond to usage on the plateform after 2015. The current usage metrics is available 48-96 hours after online publication and is updated daily on week days.
Initial download of the metrics may take a while.