Fig. 15.
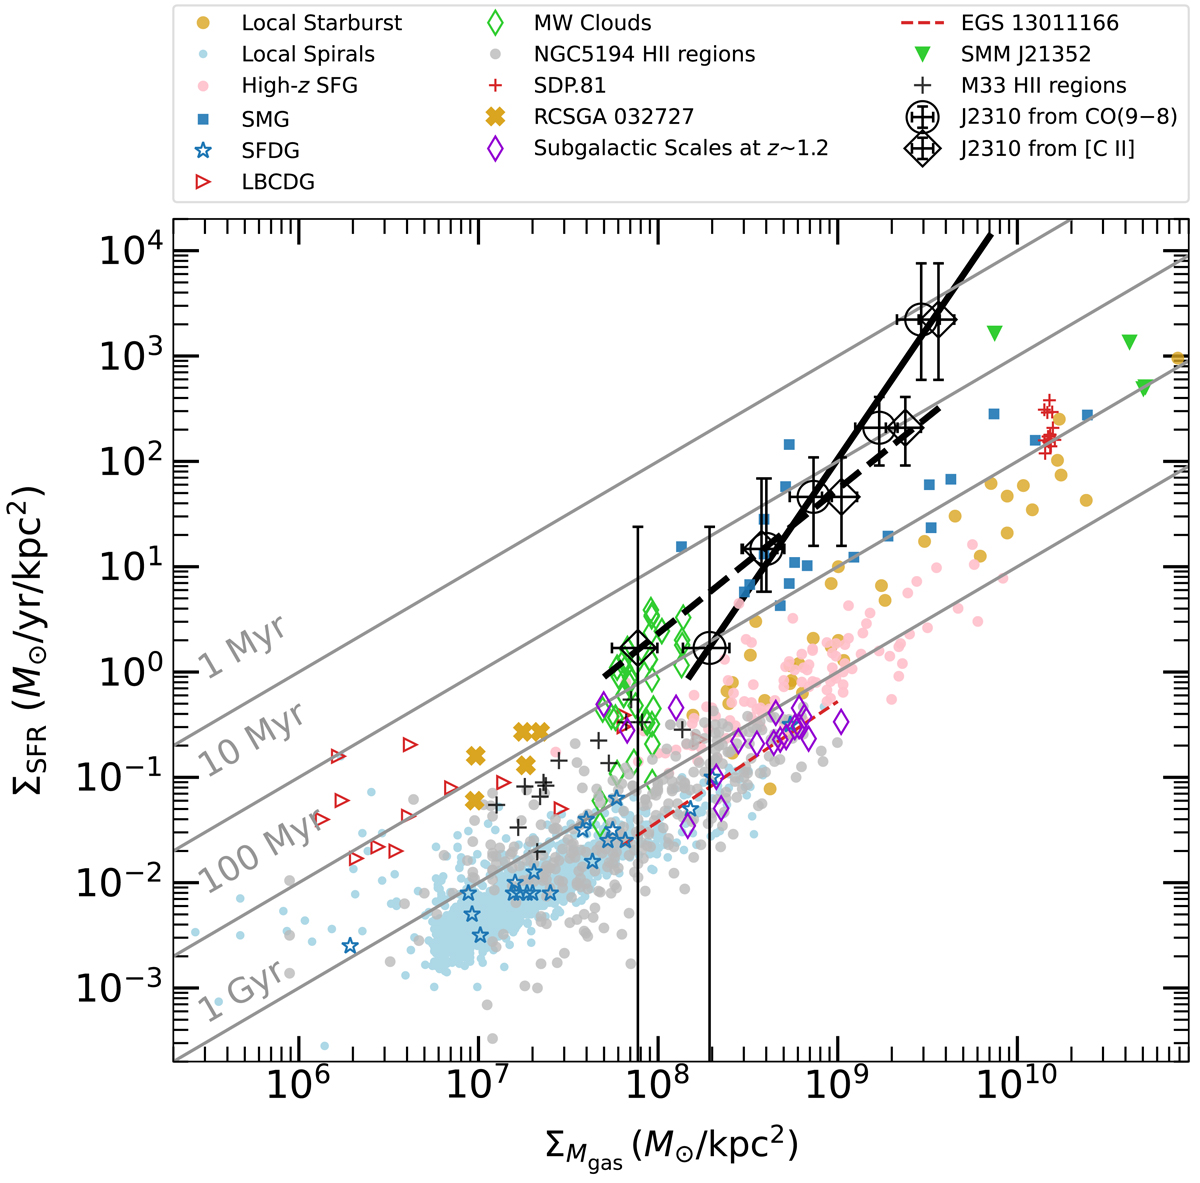
Download original image
Spatially resolved KS plot for J2310+1855 (black open circles with error bars, and its best-fit power-law shown as black solid line when calculating ΣMgas from the CO (9–8) line; black open diamonds with error bars, and its best-fit power-law shown as dashed black line when calculating ΣMgas from the [C II] line), compared with the surface density KS relations of other galaxy samples including local starburst galaxies (brown filled circles; Kennicutt 1998), local spiral galaxies (blue filled circles; Kennicutt 1998; Bigiel et al. 2010), z ∼ 1–3 star-forming galaxies (pink filled circles; Genzel et al. 2010; Freundlich et al. 2013; Tacconi et al. 2013), z ∼ 2–4 SMGs (blue filled squares; Bothwell et al. 2010; Genzel et al. 2010; Carilli et al. 2010), star-forming dusty galaxies (blue open stars; Villanueva et al. 2017), local blue compact dwarf galaxies (red open triangles; Amorín et al. 2016), and some spatially resolved galaxies – Milky Way clumps (green open diamonds; Heiderman et al. 2010; Evans et al. 2014), star-forming regions of the spiral galaxy NGC 5194 (gray filled circles; Kennicutt et al. 2007), the lensed SMG SDP.81 at z = 3.042 (red pluses; Hatsukade et al. 2015), the young low-metallicity starburst galaxy RCSGA 032727 at z = 1.7 (brown crosses; González-López et al. 2017), massive star-forming galaxies around z = 1.2 (purple open diamonds; Freundlich et al. 2013), the z = 1.5 star-forming galaxy EGS13011166 (dashed red line; Genzel et al. 2013), the lensed SMG SMMJ21352 at z = 2.3 (green filled triangles; Thomson et al. 2015), and the H II regions in the nearby spiral galaxy M33 (black crosses; Miura et al. 2014). The solid gray lines represent gas depletion timescales of 1Myr, 10 Myr, 100 Myr, and 1 Gyr. We applied a 1.36 correction factor to the molecular hydrogen mass for the presence of helium for the comparison samples. For our target, the conversion factor to the gas mass is from the dynamical modeling, which should include the contributions from all other elements (e.g., helium). When deriving the index of the KS power-law with the ΣMgas derived from the [C II] line, we do not use the innermost measurement, as the observed [C II] emission in the central of the galaxy is highly suppressed due to the high dust opacity (see Sect. 5.1.1).
Current usage metrics show cumulative count of Article Views (full-text article views including HTML views, PDF and ePub downloads, according to the available data) and Abstracts Views on Vision4Press platform.
Data correspond to usage on the plateform after 2015. The current usage metrics is available 48-96 hours after online publication and is updated daily on week days.
Initial download of the metrics may take a while.