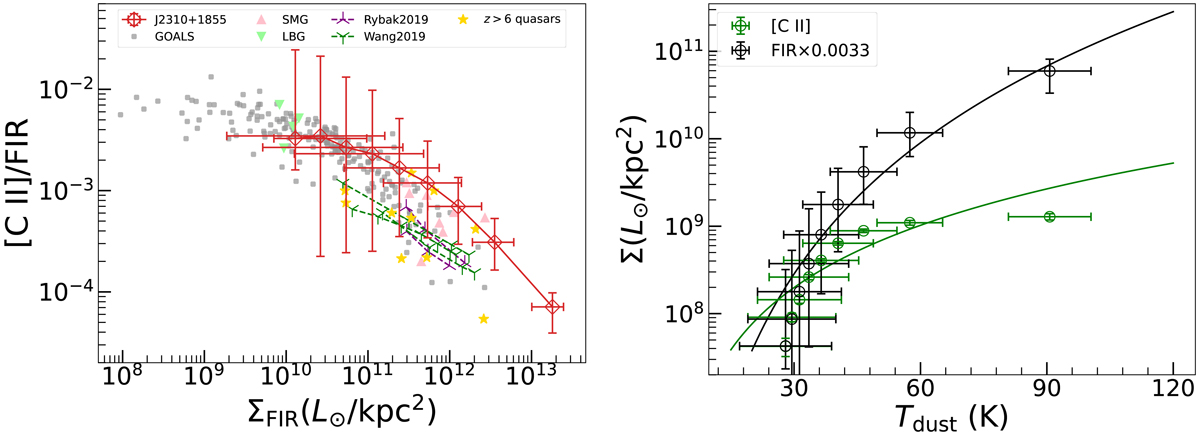
Fig. 14.
Download original image
[C II]-FIR deficit. Left panel: [C II]/FIR luminosity ratio as a function of FIR surface brightness. The red open diamonds with error bars connected by the solid red line represent measurements for J2310+1855. The comparison samples are spatially resolved z ∼ 6 quasars (green triangles connected by dashed lines; Wang et al. 2019) and z ∼ 3 SMGs (purple triangles connected by dashed lines; Rybak et al. 2019), other z > 6 quasars (yellow stars; Wang et al. 2013; Venemans et al. 2016, 2017; Decarli et al. 2018), other high-z SMGs (pink triangles; Riechers et al. 2013; Neri et al. 2014; Gullberg et al. 2018; Rybak et al. 2019), the GOALS sample of local luminous infrared galaxies (gray circles; Díaz-Santos et al. 2013, 2017), and LBGs (green triangles; Capak et al. 2015; Jones et al. 2017; Hashimoto et al. 2019a). Right panel: Comparison between the trends of the surface brightnesses of [C II] (green circles with error bars) and the scaled FIR (black circles with error bars) luminosities, as a function of dust temperature. The green and black lines are the power-law fits to the Σ[C II] and ΣFIR as a function of Tdust, respectively.
Current usage metrics show cumulative count of Article Views (full-text article views including HTML views, PDF and ePub downloads, according to the available data) and Abstracts Views on Vision4Press platform.
Data correspond to usage on the plateform after 2015. The current usage metrics is available 48-96 hours after online publication and is updated daily on week days.
Initial download of the metrics may take a while.