Fig. 13.
Download original image
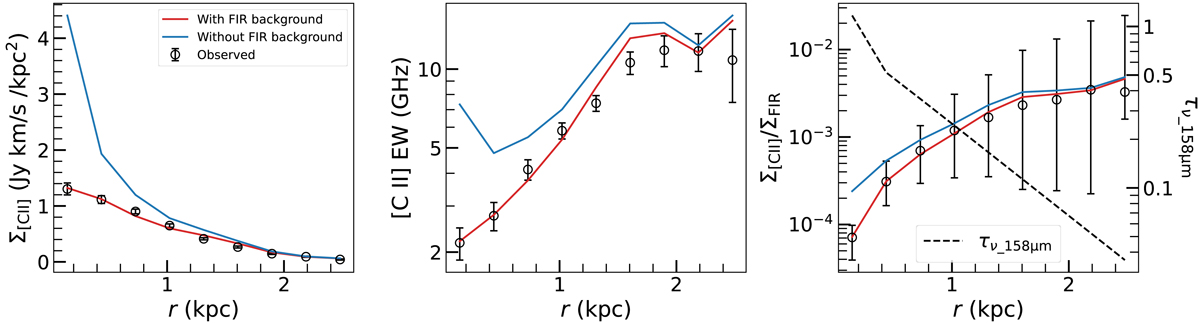
RADEX modeling of the [C II] line emission with (red lines) and without (blue lines) FIR background caused by high dust opacity in the quasar host galaxy, and compared with the observed [C II] line emission (black circles with error bars): the [C II] surface brightness profile (left panel), the [C II] line equivalent width (middle panel), and the ratio between Σ[C II] and ΣFIR (right panel) as a function of radius. The dashed black line in the right panel represents the radial distribution of the optical depth at the frequency of the [C II] underlying dust continuum.
Current usage metrics show cumulative count of Article Views (full-text article views including HTML views, PDF and ePub downloads, according to the available data) and Abstracts Views on Vision4Press platform.
Data correspond to usage on the plateform after 2015. The current usage metrics is available 48-96 hours after online publication and is updated daily on week days.
Initial download of the metrics may take a while.