Fig. 12.
Download original image
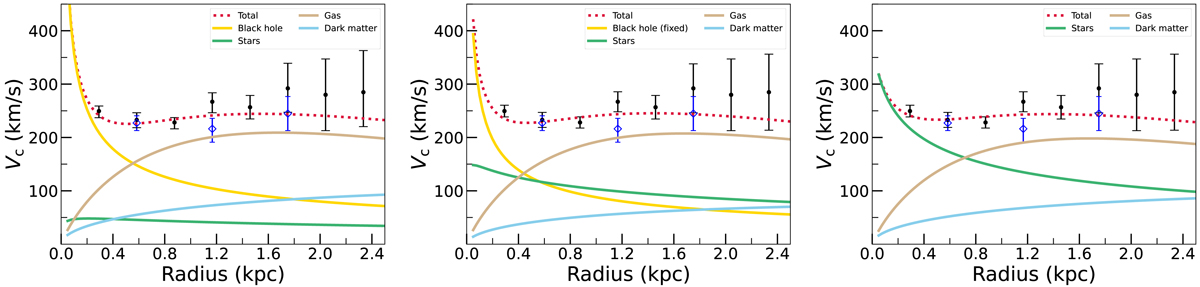
Best-fit of the decomposition of the circular rotation curve traced by the [C II] line when allowing the black hole component to be free (left), fixed to 1.8 × 10⁹ M⊙ (Feruglio et al. 2018; middle) and none (right). Black points with error bars are the circular velocities, these are the rotation velocities corrected for the asymmetric drift (caused by gas random motions). The solid yellow, green, brown and blue lines represent the black hole, stellar, gas and dark matter components, respectively. The dashed red lines are the sum of these four components. The blue diamonds with error bars are the circular velocities measured from the CO (9–8) line. These two lines trace the identical gravitational potential within the errors.
Current usage metrics show cumulative count of Article Views (full-text article views including HTML views, PDF and ePub downloads, according to the available data) and Abstracts Views on Vision4Press platform.
Data correspond to usage on the plateform after 2015. The current usage metrics is available 48-96 hours after online publication and is updated daily on week days.
Initial download of the metrics may take a while.