Fig. 10.
Download original image
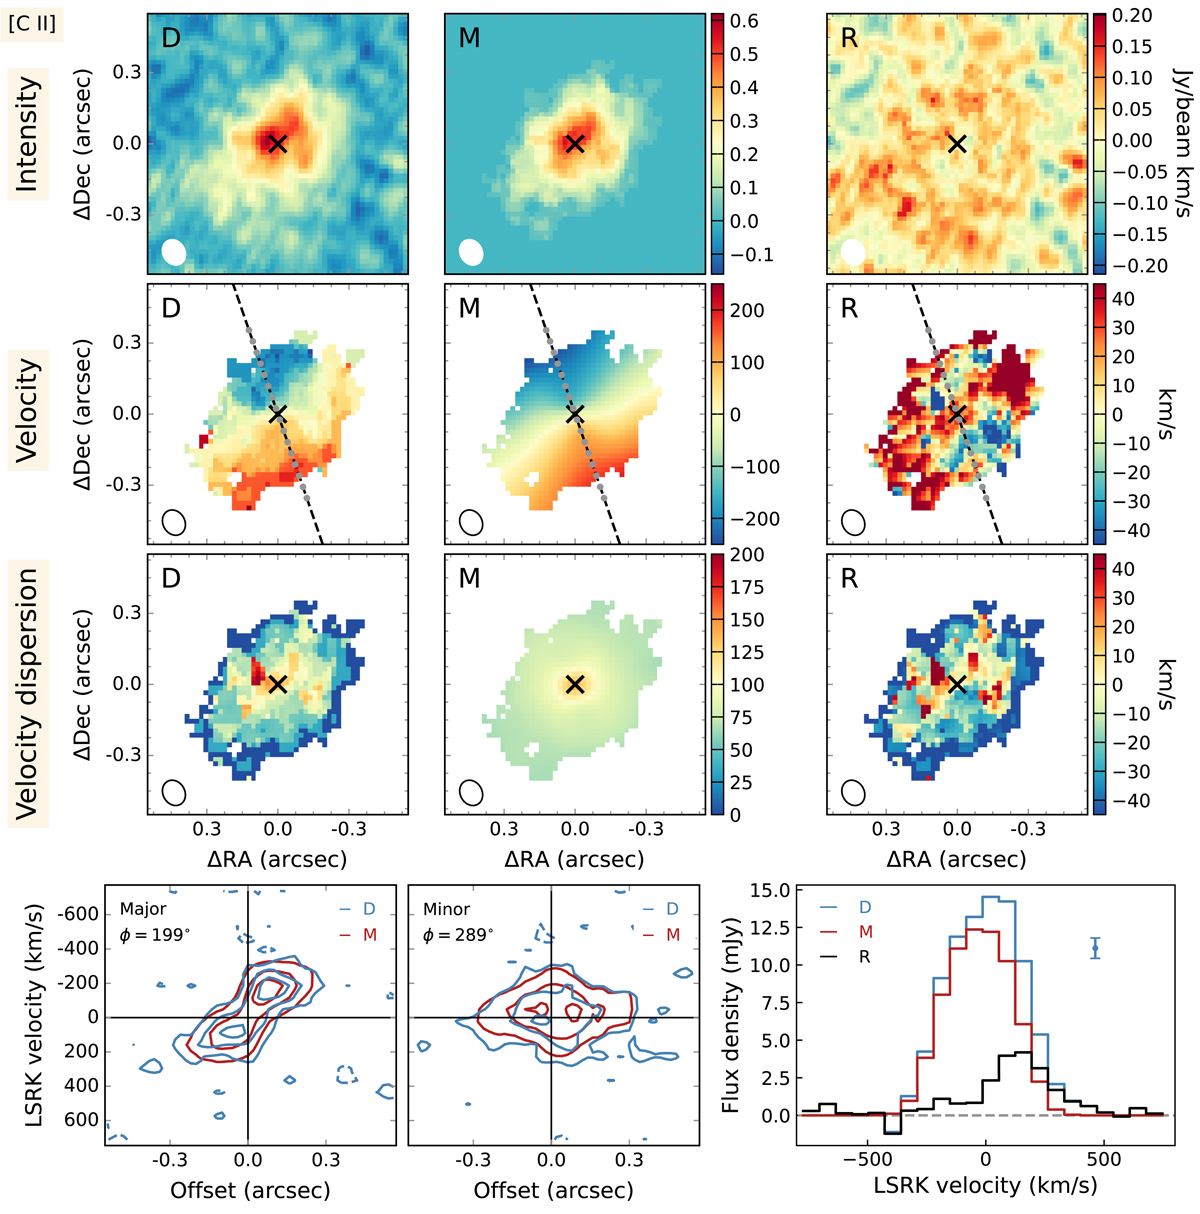
Observed and modeled [C II] line of J2310+1855. Upper-left panels: intensity, velocity, and velocity dispersion maps for the observed data from top to bottom, which are labeled “D.” Upper-central panels: Same as the left panels but for the best-fit modeling from 3DBAROLO, labeled “M”. Upper-right panels: same as the left panels but for the residuals between the observed data (“D”) and the modeled ones (“M”), which are labeled “R” (note that the dynamical range of these panels are different from others). The black cross in each panel marks the center of the rotating gas disk. The shape of the synthesized beam with a FWHM size of ![]() is plotted in the bottom-left corner of each panel. In the velocity field panels, the dashed black lines are the kinematic major axis of the gas disk, and the plotted solid gray dots represent the ring positions. Lower-left and lower-middle panels: position-velocity maps extracted along the kinematic major and minor axes from the observed data cube (blue contours) and the 3DBAROLO model cube (red contours). The contour levels are [−2, 2, 6, 10] × 0.15 mJy beam−1 for both the data and the model. Lower-right panel: [C II] spectra extracted from the observed data cube (blue histogram) and the 3DBAROLO model cube (red histogram). The residual spectrum between the data and the model is shown as the black histogram. The spectral resolution is 62.5 MHz, corresponding to 68 km s−1. In the 3DBAROLO modeling, we used a re-binned (four original channels) data cube in order to optimize the data S/N per frequency and velocity bins and the sampling of the FWHM of the [C II] line.
is plotted in the bottom-left corner of each panel. In the velocity field panels, the dashed black lines are the kinematic major axis of the gas disk, and the plotted solid gray dots represent the ring positions. Lower-left and lower-middle panels: position-velocity maps extracted along the kinematic major and minor axes from the observed data cube (blue contours) and the 3DBAROLO model cube (red contours). The contour levels are [−2, 2, 6, 10] × 0.15 mJy beam−1 for both the data and the model. Lower-right panel: [C II] spectra extracted from the observed data cube (blue histogram) and the 3DBAROLO model cube (red histogram). The residual spectrum between the data and the model is shown as the black histogram. The spectral resolution is 62.5 MHz, corresponding to 68 km s−1. In the 3DBAROLO modeling, we used a re-binned (four original channels) data cube in order to optimize the data S/N per frequency and velocity bins and the sampling of the FWHM of the [C II] line.
Current usage metrics show cumulative count of Article Views (full-text article views including HTML views, PDF and ePub downloads, according to the available data) and Abstracts Views on Vision4Press platform.
Data correspond to usage on the plateform after 2015. The current usage metrics is available 48-96 hours after online publication and is updated daily on week days.
Initial download of the metrics may take a while.