Fig. 1.
Download original image
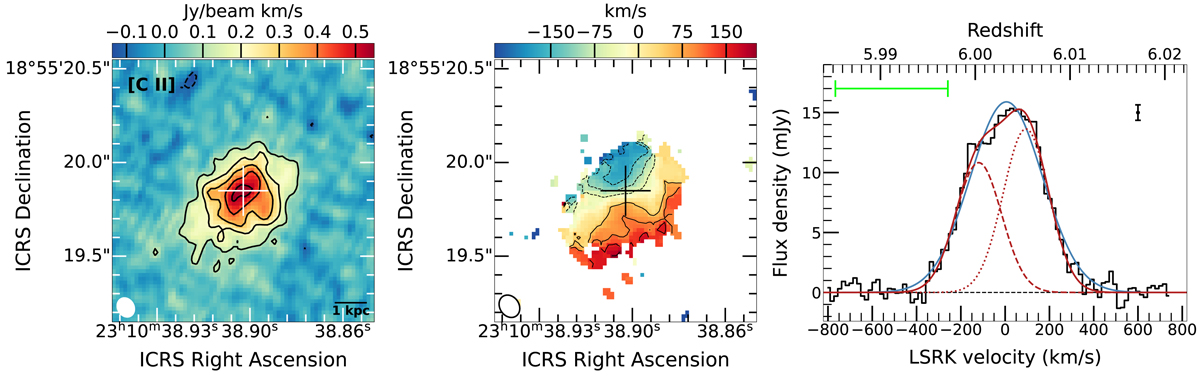
ALMA observed [C II] line. Left panel: [C II] velocity-integrated map. The white plus sign is the Hubble Space Telescope (HST) quasar position (RA of 23:10:38.90; Dec of 18:55:19.85). The shape of the restoring beam with a FWHM size of ![]() ×
× ![]() is plotted in the bottom-left corner. The contour levels are [−3, 3, 6, 9, 12, 15] × rms[C II], where rms[C II] = 0.035 Jy beam−1 km s−1. Middle panel: [C II] velocity map produced using pixels above 4σ in the channel maps. The black plus sign is the HST quasar position. A clear velocity gradient can be seen. Right panel: [C II] line spectrum (black histogram) overplotted with the best-fit Gaussian profiles. The spectrum is extracted from the 2σ region of the source emitting area in the [C II] intensity map. The solid blue line presents the best-fit single Gaussian model. The solid red line represents the best-fit double-Gaussian model, and the dashed and dotted red lines are for each of the double Gaussians. The kinematic local standard of rest (LSRK) velocity scale is relative to the [C II] redshift from our ALMA Cycle 0 observations (Wang et al. 2013). The spectral resolution is 15.625 MHz, corresponding to 17 km s−1. The rms of the spectrum measured using the line-free spectrum is 0.65 mJy and is shown as a black bar. The [C II] spectral profile is asymmetric, with enhancement on the red side. The green bar indicates the velocity range of the OH+ absorption.
is plotted in the bottom-left corner. The contour levels are [−3, 3, 6, 9, 12, 15] × rms[C II], where rms[C II] = 0.035 Jy beam−1 km s−1. Middle panel: [C II] velocity map produced using pixels above 4σ in the channel maps. The black plus sign is the HST quasar position. A clear velocity gradient can be seen. Right panel: [C II] line spectrum (black histogram) overplotted with the best-fit Gaussian profiles. The spectrum is extracted from the 2σ region of the source emitting area in the [C II] intensity map. The solid blue line presents the best-fit single Gaussian model. The solid red line represents the best-fit double-Gaussian model, and the dashed and dotted red lines are for each of the double Gaussians. The kinematic local standard of rest (LSRK) velocity scale is relative to the [C II] redshift from our ALMA Cycle 0 observations (Wang et al. 2013). The spectral resolution is 15.625 MHz, corresponding to 17 km s−1. The rms of the spectrum measured using the line-free spectrum is 0.65 mJy and is shown as a black bar. The [C II] spectral profile is asymmetric, with enhancement on the red side. The green bar indicates the velocity range of the OH+ absorption.
Current usage metrics show cumulative count of Article Views (full-text article views including HTML views, PDF and ePub downloads, according to the available data) and Abstracts Views on Vision4Press platform.
Data correspond to usage on the plateform after 2015. The current usage metrics is available 48-96 hours after online publication and is updated daily on week days.
Initial download of the metrics may take a while.