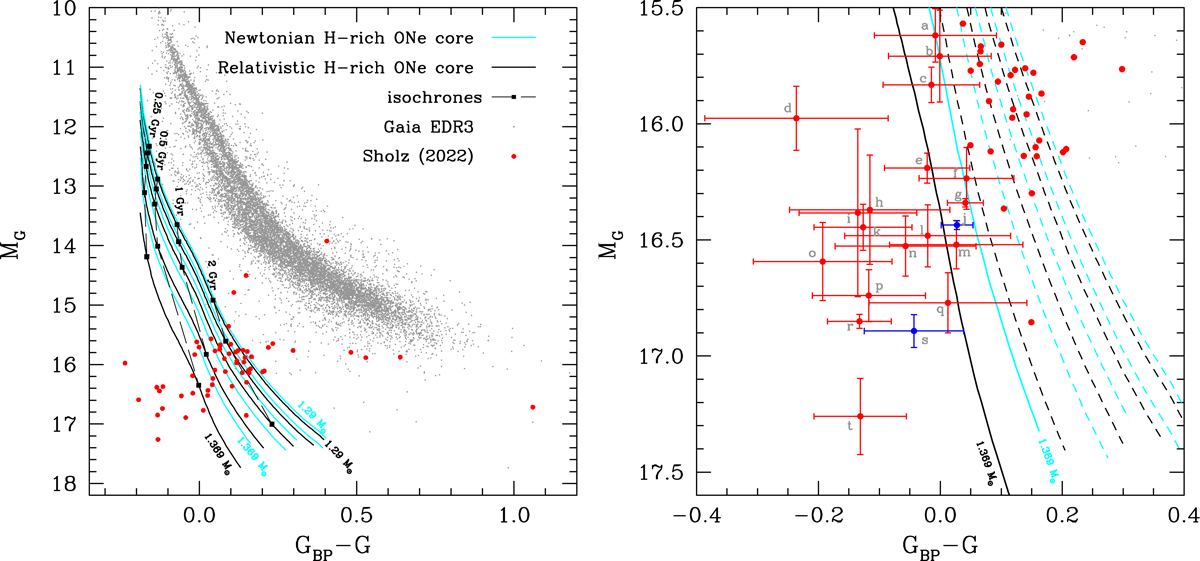
Fig. 7.
Download original image
Theoretical and observational color-magnitude diagrams. Left panel: Gaia EDR3 color-magnitude diagram. Newtonian and general relativistic cooling sequences are displayed using cyan and black lines, respectively. Their rest masses are, from top to bottom, 1.29, 1.31, 1.33, 1.35, and 1.369 M⊙. The Gaia white dwarf population within 100 pc is displayed using gray dots. The faint blue white dwarf branch reported in Scholz (2022) is displayed using large red filled circles. Dashed lines show isochrones of 0.25, 0.5, 1, 2 Gyr. Right panel: zoomed-in view of the faint blue white dwarf branch. Objects {j, s} (marked in blue) are ideal candidates, compatible at a 1σ level with the general relativistic model but marginally at a 2σ level with Newtonian models.
Current usage metrics show cumulative count of Article Views (full-text article views including HTML views, PDF and ePub downloads, according to the available data) and Abstracts Views on Vision4Press platform.
Data correspond to usage on the plateform after 2015. The current usage metrics is available 48-96 hours after online publication and is updated daily on week days.
Initial download of the metrics may take a while.