Open Access
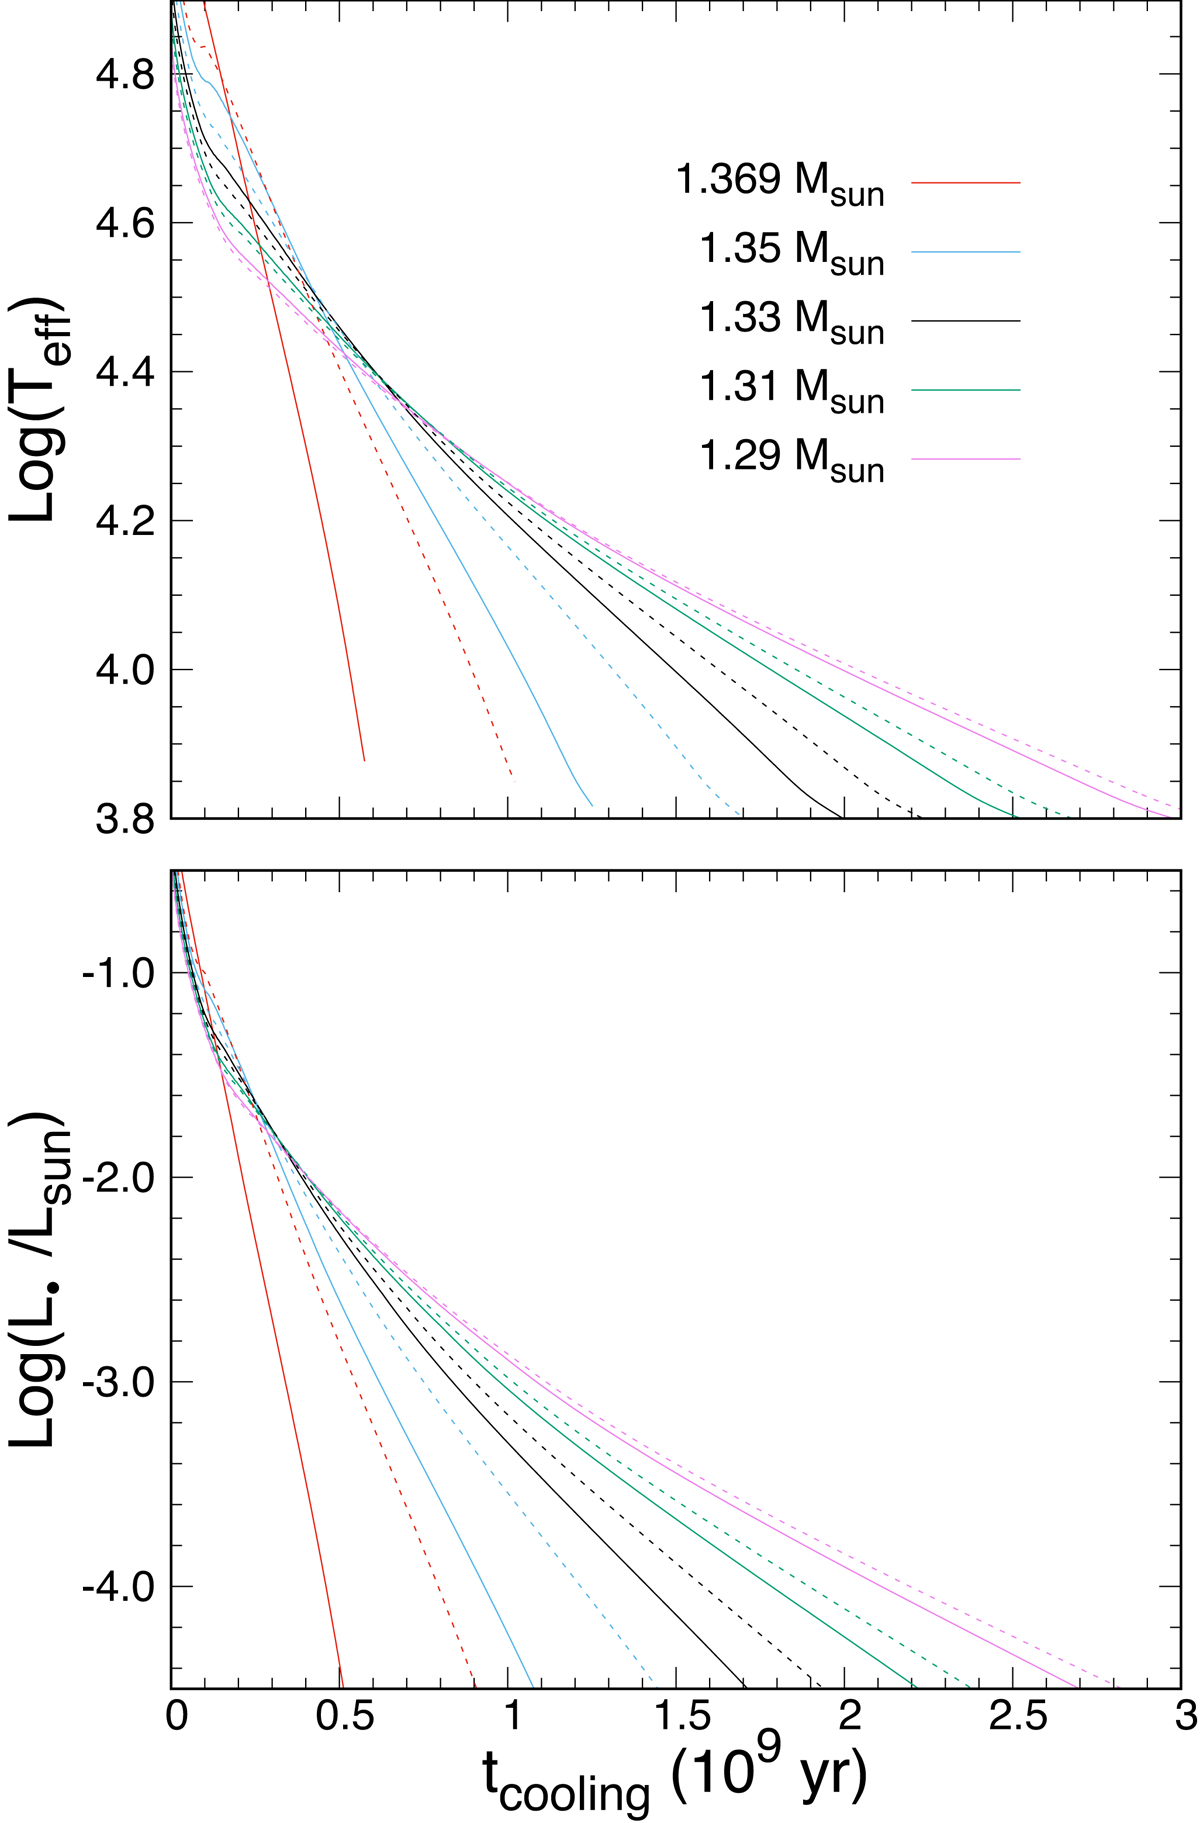
Fig. 6.
Download original image
Effective temperature and surface luminosity (upper and bottom panels) versus the cooling times for our 1.29, 1.31, 1.33, 1.35, and 1.369 M⊙ white dwarf sequences. Solid (dashed) lines correspond to the general relativity (Newtonian) cases. Cooling time is counted from the time of white dwarf formation.
Current usage metrics show cumulative count of Article Views (full-text article views including HTML views, PDF and ePub downloads, according to the available data) and Abstracts Views on Vision4Press platform.
Data correspond to usage on the plateform after 2015. The current usage metrics is available 48-96 hours after online publication and is updated daily on week days.
Initial download of the metrics may take a while.