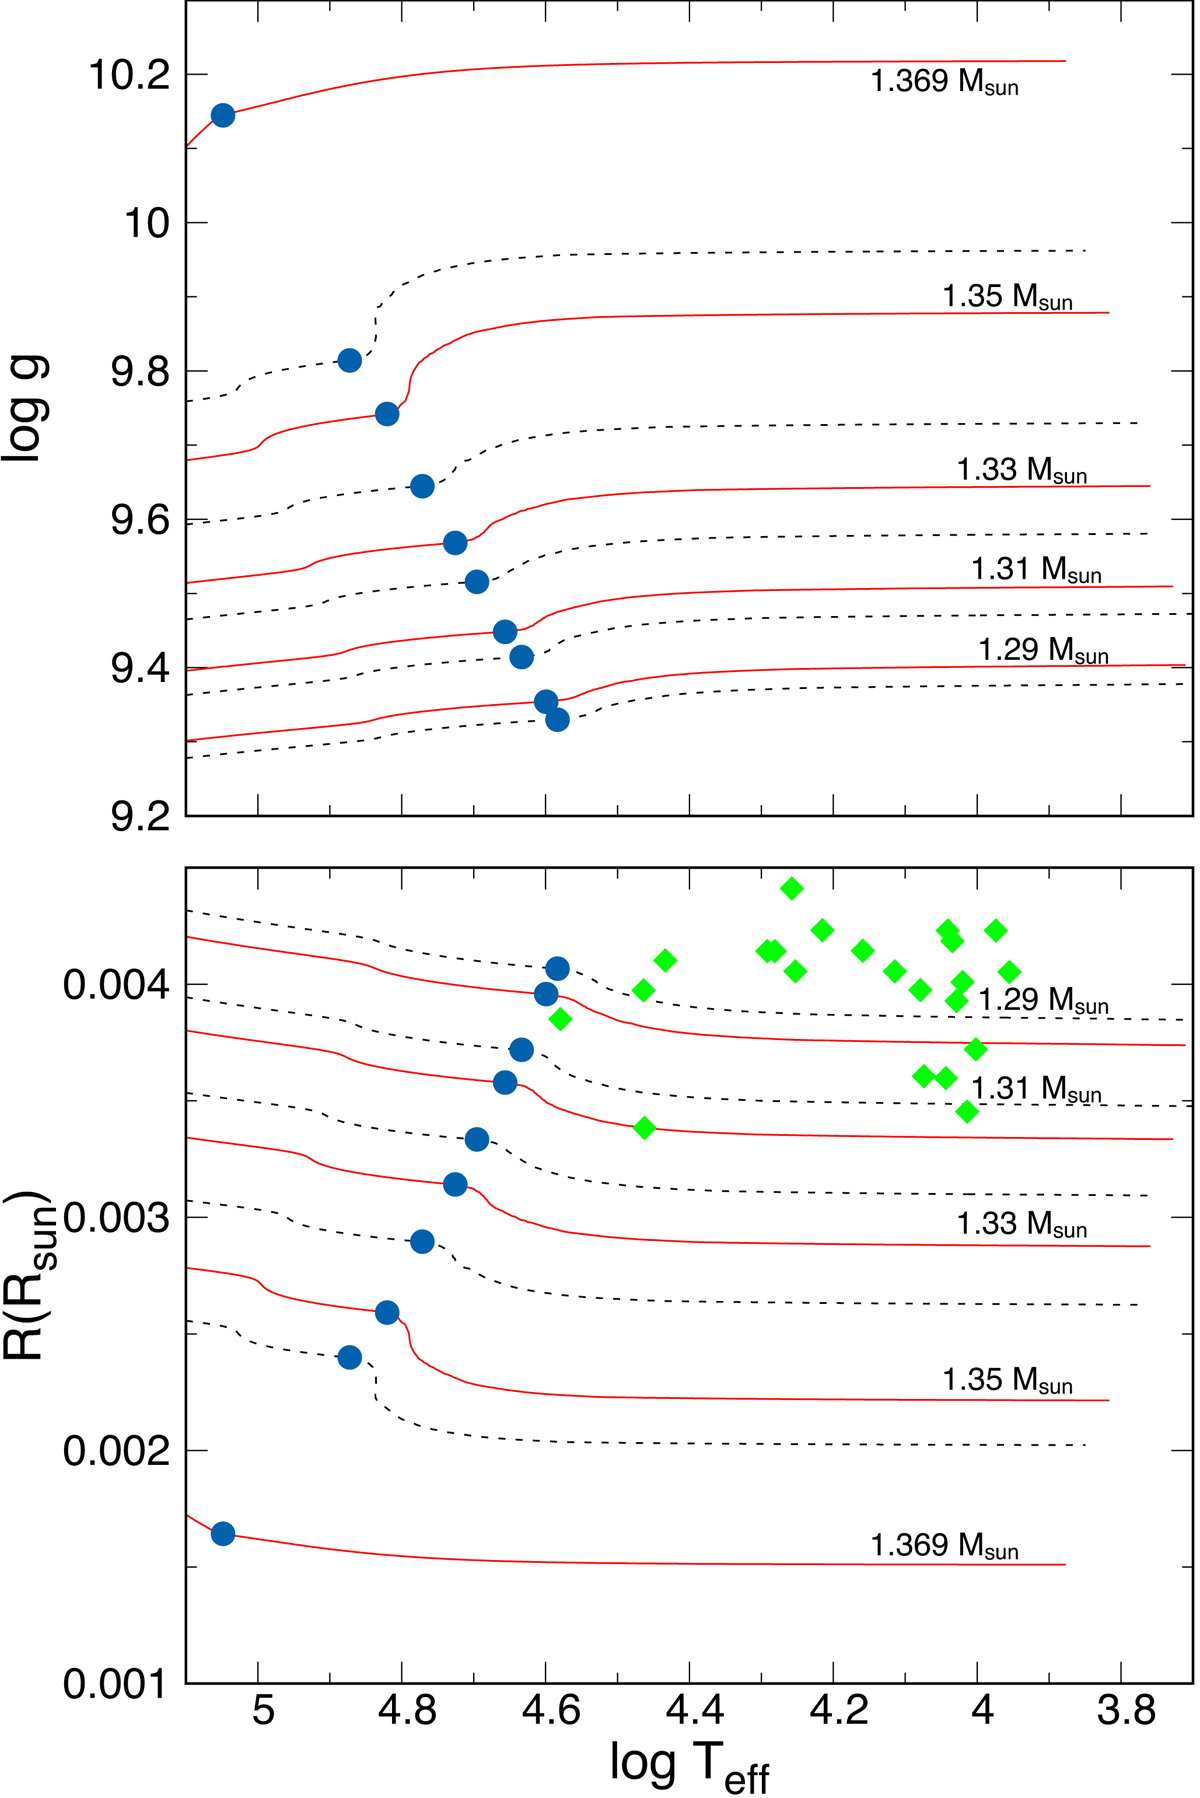
Fig. 5.
Download original image
Surface gravity and stellar radius (in solar units) in terms of effective temperature for all of our sequences are displayed in the upper and bottom panels, respectively. Red solid and black dotted lines correspond to the general relativity and Newtonian cases, respectively. From bottom (top) to top (bottom), curves in the upper (bottom) panel correspond to 1.29, 1.31, 1.33, 1.35, and 1.369 M⊙ white dwarf cooling sequences. Blue filled circles denote the onset of core crystallization in each sequence. The most massive white dwarfs in the solar neighborhood analyzed in Kilic et al. (2021) are displayed using green filled diamonds.
Current usage metrics show cumulative count of Article Views (full-text article views including HTML views, PDF and ePub downloads, according to the available data) and Abstracts Views on Vision4Press platform.
Data correspond to usage on the plateform after 2015. The current usage metrics is available 48-96 hours after online publication and is updated daily on week days.
Initial download of the metrics may take a while.