Fig. 5
Download original image
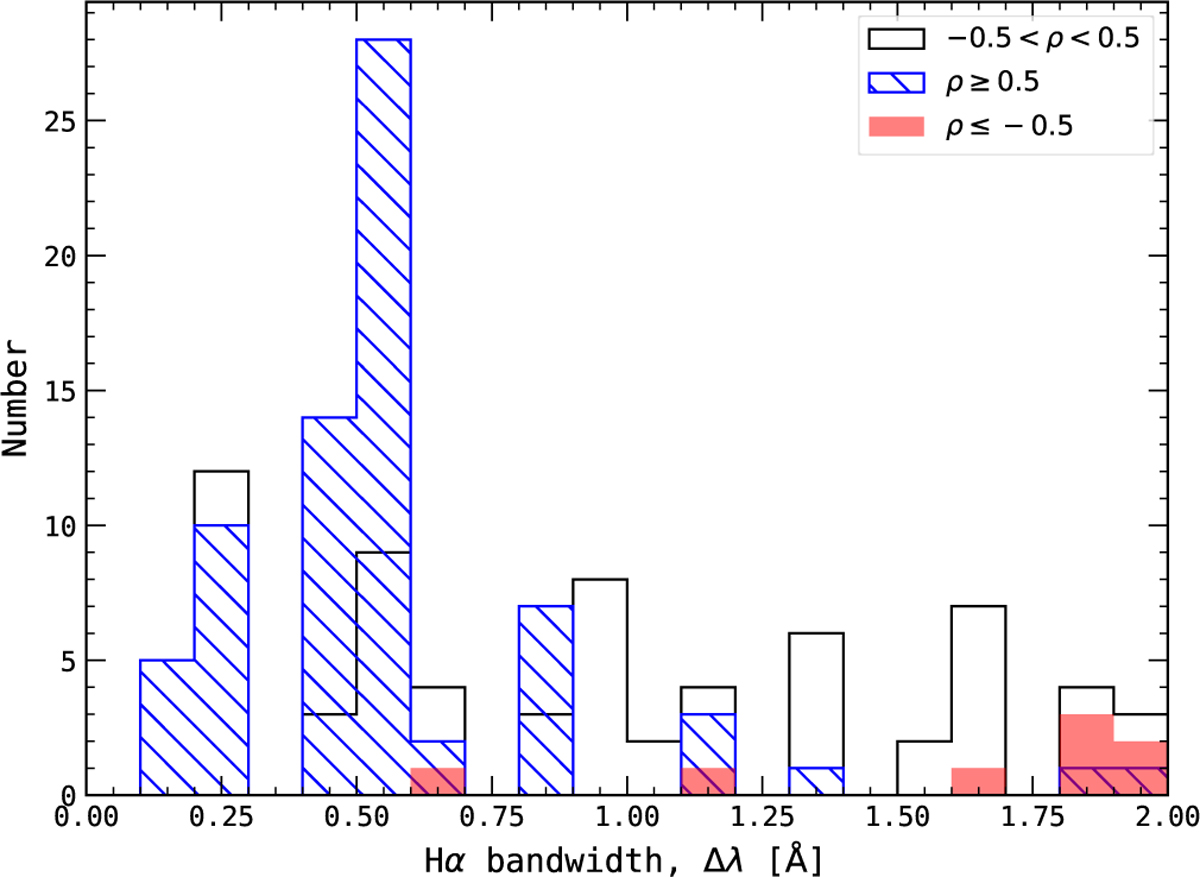
Distribution of bandpasses that maximise the correlation between Hα and Ca II. The black histogram shows the bandpass distribution for stars with a weak or no correlation coefficient (−0.5 < ρ < 0.5), the blue hatched histogram shows stars with strong positive correlations (ρ ≥ 0.5), and the red histogram shows stars with strong negative correlations (ρ ≤ −0.5).
Current usage metrics show cumulative count of Article Views (full-text article views including HTML views, PDF and ePub downloads, according to the available data) and Abstracts Views on Vision4Press platform.
Data correspond to usage on the plateform after 2015. The current usage metrics is available 48-96 hours after online publication and is updated daily on week days.
Initial download of the metrics may take a while.