Fig. 4
Download original image
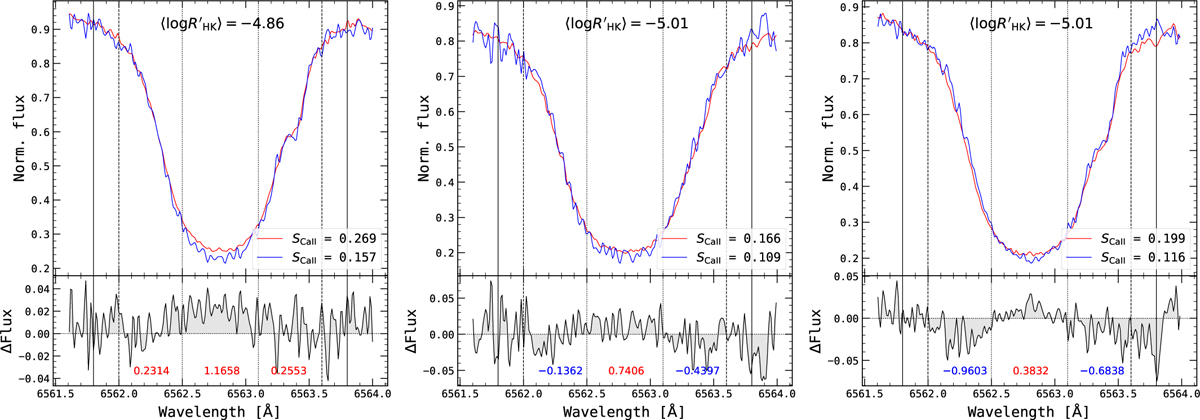
Flux in the Hα line for different levels of activity. Upper panels: Hα line profiles of HD 215152 (left), HD 20003 (middle), and HD 7199 (right) at their maxima (red) and minima (blue) activity levels. Lower panels: difference between the fluxes at the maximum and minimum of activity for each star. Vertical lines show bandwidths of 2.0 Å (solid), 1.6 Å (dashed), and 0.6 Å (dotted). The numbers in the lower panels show the integrated flux difference in each region delimited by the vertical lines in red if positive and blue if negative.
Current usage metrics show cumulative count of Article Views (full-text article views including HTML views, PDF and ePub downloads, according to the available data) and Abstracts Views on Vision4Press platform.
Data correspond to usage on the plateform after 2015. The current usage metrics is available 48-96 hours after online publication and is updated daily on week days.
Initial download of the metrics may take a while.