Fig. 3
Download original image
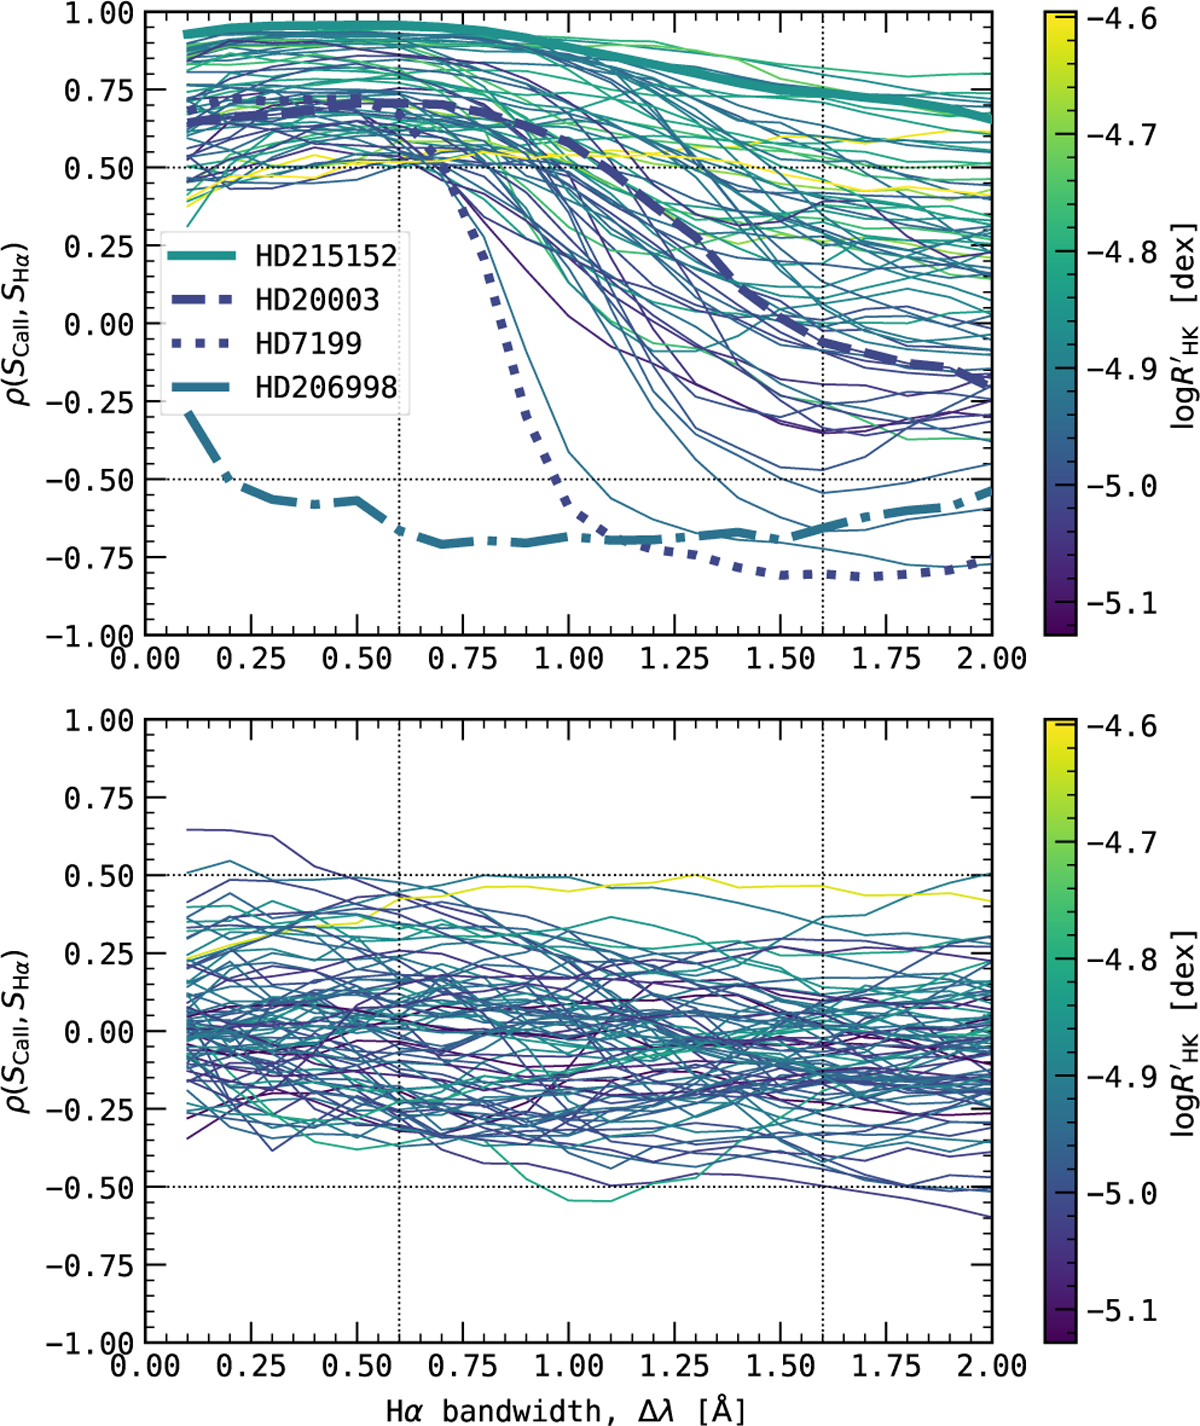
Effect of varying the Hα bandwidth in the correlation between Ca II and Hα coloured after activity level, measured as logR′HK. Upper panel: stars with strong positive (ρ ≥ 0.5) or negative (ρ ≤ −0.5) correlation with the SHα06 index. Stars marked with thick lines are examples used in Figs. 4, 7, and A.2, and the only case of negative correlation with SHα06 (HD 206998). Lower panel: stars with weak or no correlation (−0.5 < ρ < 0.5) with the SHα06 index. In both panels, as an indication, we mark the boundaries between strong and no correlation with horizontal dotted lines at ρ values of 0.5 and −0.5.
Current usage metrics show cumulative count of Article Views (full-text article views including HTML views, PDF and ePub downloads, according to the available data) and Abstracts Views on Vision4Press platform.
Data correspond to usage on the plateform after 2015. The current usage metrics is available 48-96 hours after online publication and is updated daily on week days.
Initial download of the metrics may take a while.