Fig. A.1
Download original image
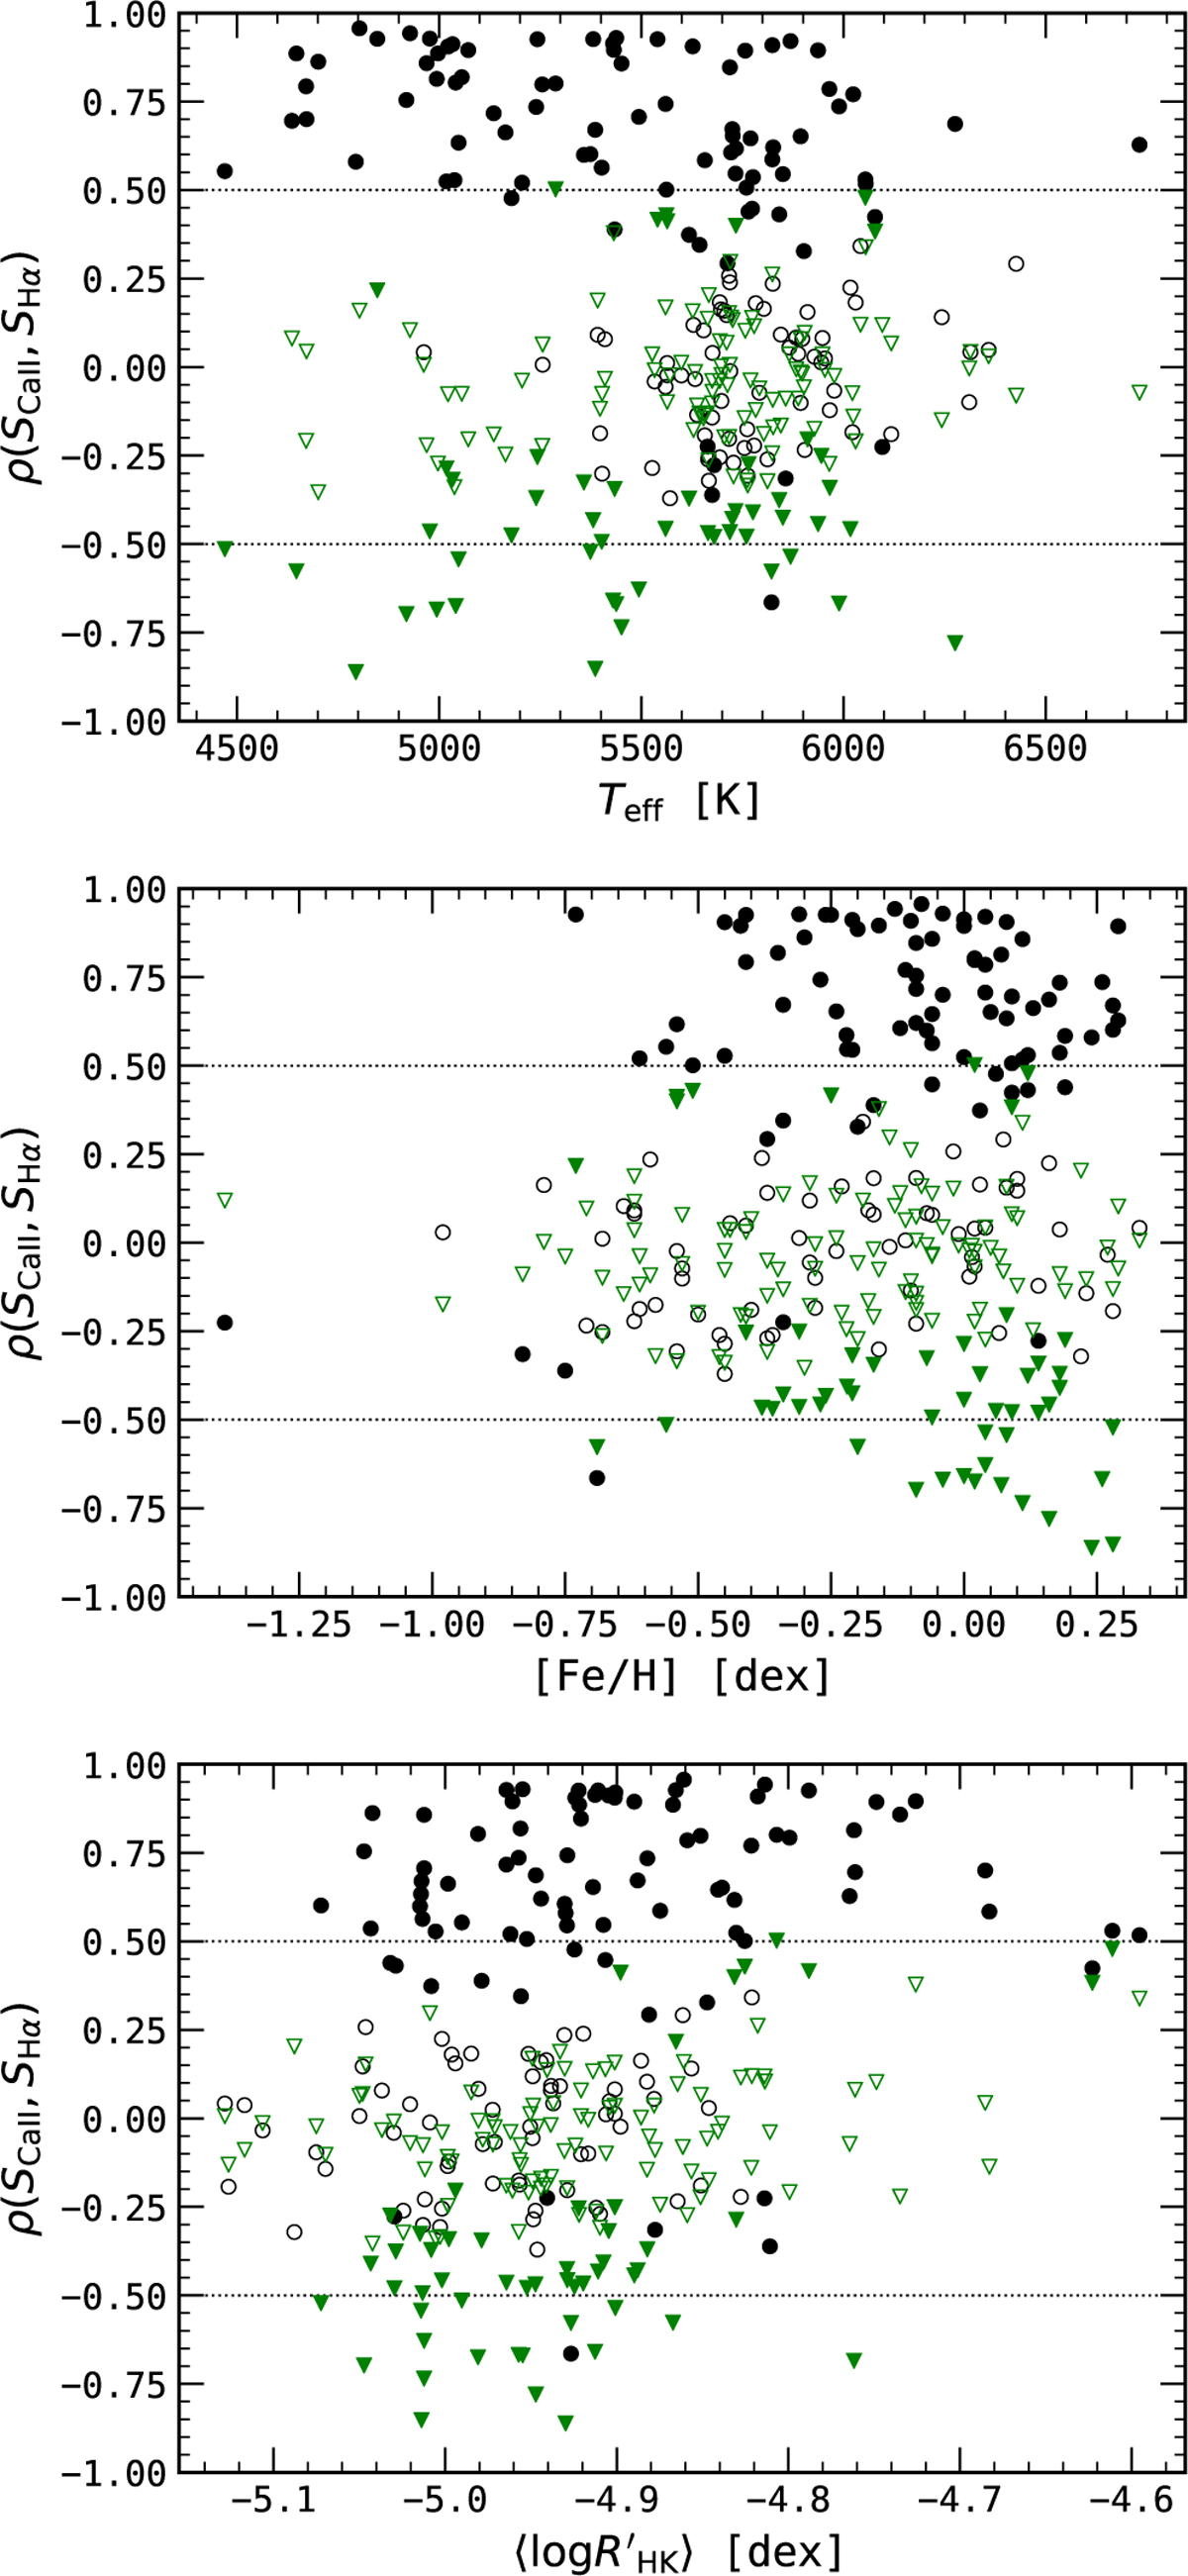
Spearman correlation coefficient between SCa II and SHα06 (black circles), and between SCa II and SHαW (green triangles) against the effective temperature (top panel), metallicity (middle panel), and median log R′HK. Horizontal dotted lines mark the thresholds for strong correlations at ρ = 0.5 and −0.5. Filled markers are significant correlations with p-value ≤ 10−3.
Current usage metrics show cumulative count of Article Views (full-text article views including HTML views, PDF and ePub downloads, according to the available data) and Abstracts Views on Vision4Press platform.
Data correspond to usage on the plateform after 2015. The current usage metrics is available 48-96 hours after online publication and is updated daily on week days.
Initial download of the metrics may take a while.