Fig. 11
Download original image
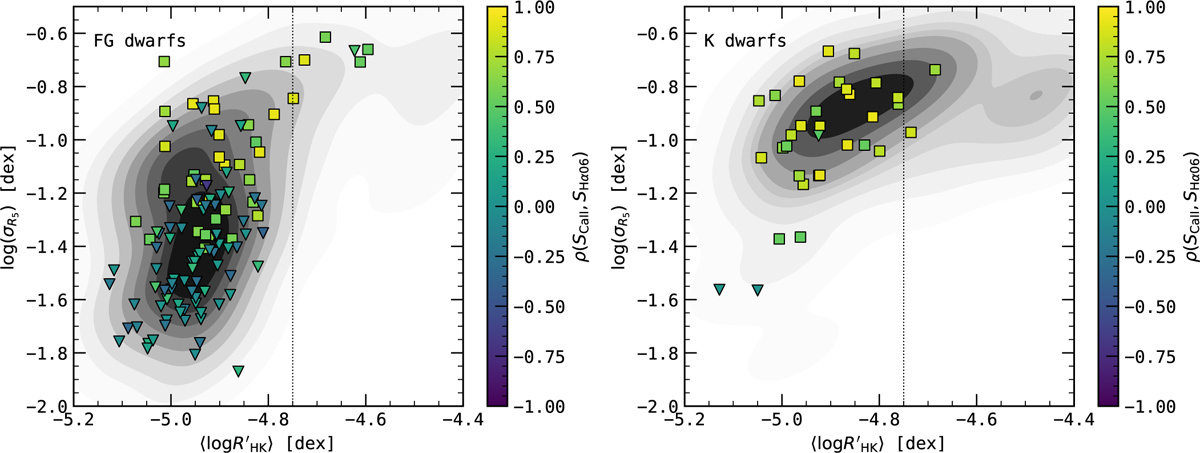
Stellar activity variability measured as ![]() versus median activity level, 〈log R′HK〉, for our sample coloured after the Spearman correlation coefficient between SCa II and SHα06. The left panel shows FG dwarfs, while the right panel shows K dwarfs. Squares are stars with ρ ≥ 0.5 (strong positive correlations), while inverted triangles are stars with ρ < 0.5. The grey scale map shows the Bivariate Kernel Density Estimate from the catalogue of Gomes da Silva et al. (2021) using just the main sequence stars of the selected spectral types of each panel. The vertical dotted line at log R′HK= −4.75 dex marks the original Vaughan-Preston gap (Vaughan & Preston 1980), separating the active and inactive stars.
versus median activity level, 〈log R′HK〉, for our sample coloured after the Spearman correlation coefficient between SCa II and SHα06. The left panel shows FG dwarfs, while the right panel shows K dwarfs. Squares are stars with ρ ≥ 0.5 (strong positive correlations), while inverted triangles are stars with ρ < 0.5. The grey scale map shows the Bivariate Kernel Density Estimate from the catalogue of Gomes da Silva et al. (2021) using just the main sequence stars of the selected spectral types of each panel. The vertical dotted line at log R′HK= −4.75 dex marks the original Vaughan-Preston gap (Vaughan & Preston 1980), separating the active and inactive stars.
Current usage metrics show cumulative count of Article Views (full-text article views including HTML views, PDF and ePub downloads, according to the available data) and Abstracts Views on Vision4Press platform.
Data correspond to usage on the plateform after 2015. The current usage metrics is available 48-96 hours after online publication and is updated daily on week days.
Initial download of the metrics may take a while.