Fig. 7
Download original image
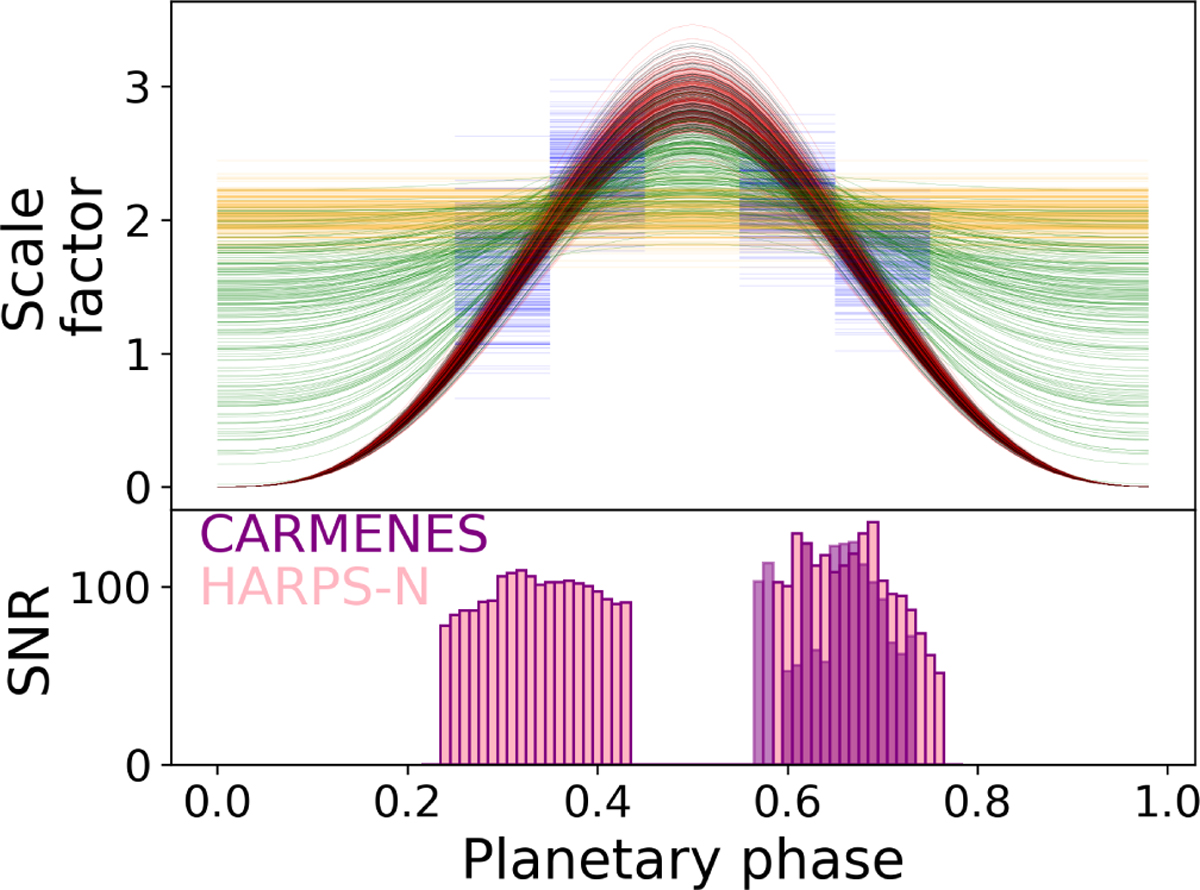
Results of our search for variations in the intensity of the observed neutral iron lines. Upper panel: 100 draws from the posterior for scaling factors as a function of phase obtained by fitting models IE (orange), 4E (blue), L (black), Loff (red) and Lbase (green) to the data. The phase coverage of the data is shown in the lower panel, in terms of the S/N of stellar spectra in each phase bin (HARPS-N: lighter pink; CARMENES: darker purple). Where multiple nights cover the same orbital phase bin, their contributions are summed in quadrature.
Current usage metrics show cumulative count of Article Views (full-text article views including HTML views, PDF and ePub downloads, according to the available data) and Abstracts Views on Vision4Press platform.
Data correspond to usage on the plateform after 2015. The current usage metrics is available 48-96 hours after online publication and is updated daily on week days.
Initial download of the metrics may take a while.