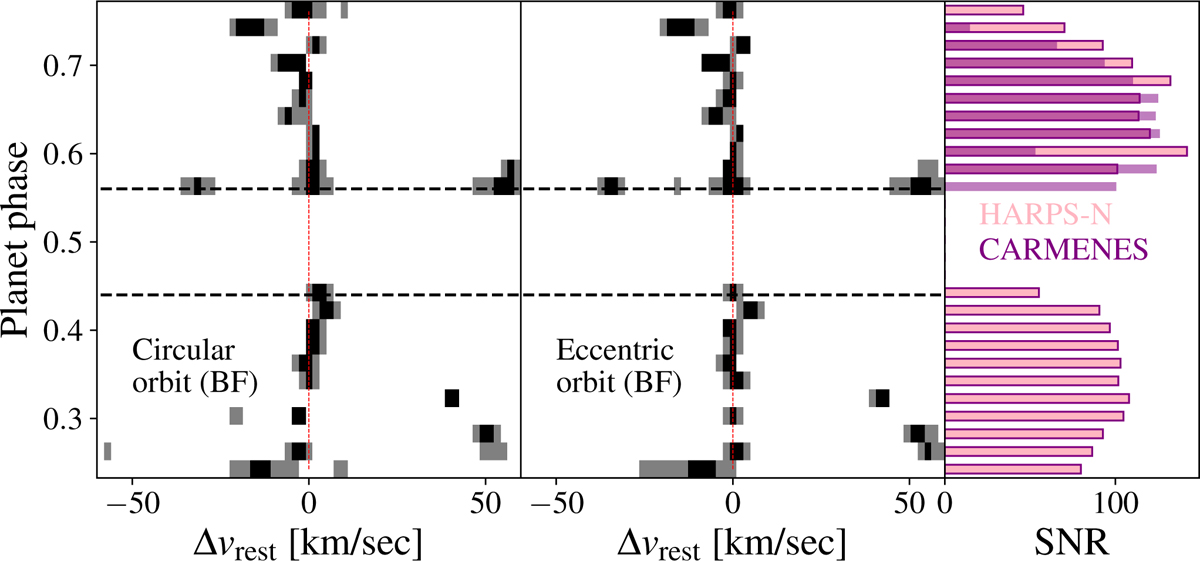
Fig. 5
Download original image
Time-resolved confidence intervals as a function of the planet rest-frame velocity obtained by binning (i.e. co-adding) the individual likelihood functions by 0.02 in orbital phase. Black represents 1σ deviations from the best-fit rest-frame velocity in each phase bin, and grey represents 2σ deviations. The left and centre panels show results for the 1C (circular) and 1E (eccentric) models, respectively, when fixing all the model parameters at their best-fit value, i.e. the median of the posterior distribution. Horizontal black dashed lines indicate phases corresponding to ingress and egress, and a vertical red dashed line indicates the best-fit planet rest-frame. The right panel represents the total S/N achieved within each phase bin, with HARPS-N (lighter pink) and CARMENES (darker purple).
Current usage metrics show cumulative count of Article Views (full-text article views including HTML views, PDF and ePub downloads, according to the available data) and Abstracts Views on Vision4Press platform.
Data correspond to usage on the plateform after 2015. The current usage metrics is available 48-96 hours after online publication and is updated daily on week days.
Initial download of the metrics may take a while.