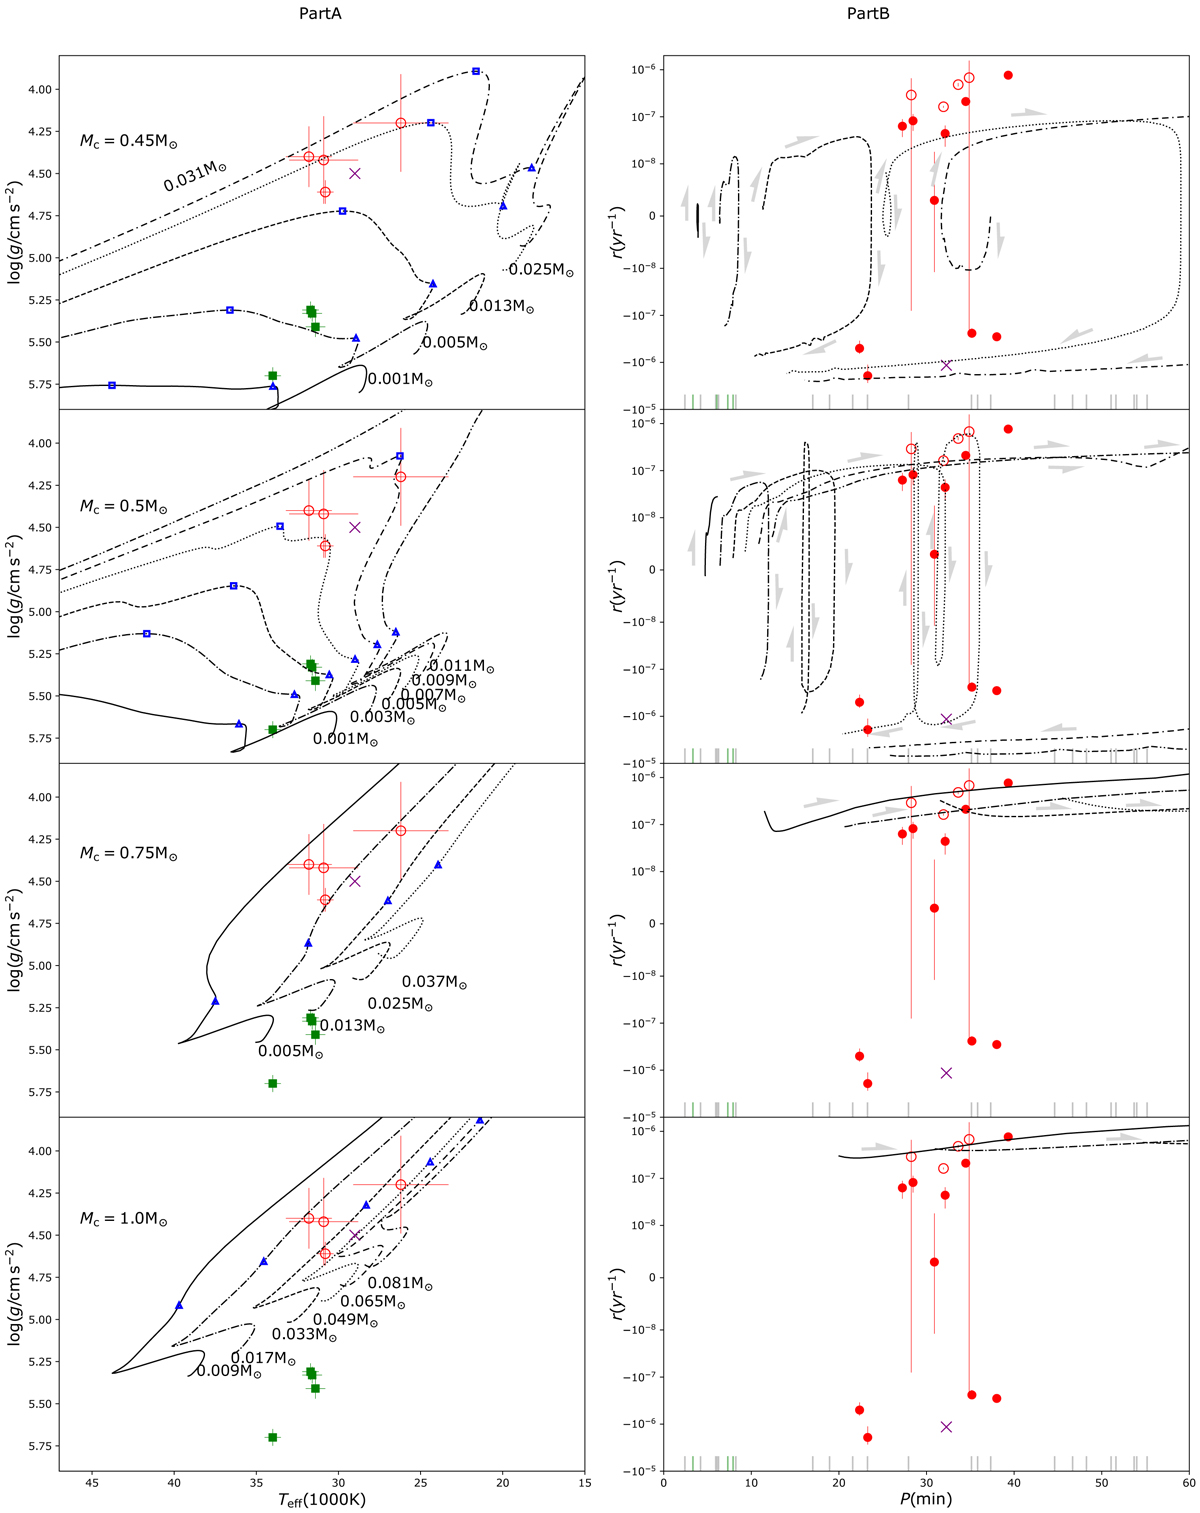
Fig. 1.
Download original image
Evolutionary tracks for constructed sdBs on the (Teff − log g) diagram (left). In each panel the core mass Mc is reported, along with different values of H-rich envelope ass, Me, indicated with different linestyles. Four BLAPs (red) and four high-gravity BLAPs (green) with known Teff and log g are overplotted with error bars for comparison (see Table 1). In the top panel, the loops on the tracks with Me = 0.025 M⊙ and 0.031 M⊙ are caused by helium core breathing pulses (Li 2012, 2017; Li et al. 2018). To the right, we show the rate of period change r = Ṗ/P versus pulsation period P for SHeB sdBs, for the same evolutionary tracks of the left panel. The observations of BLAPs (Pietrukowicz et al. 2017, with r), high-gravity BLAPs (Kupfer et al. 2015, without r) and the candidates (McWhirter & Lam 2022, without r) are shown respectively with red dots (open circles highlighting stars with spectroscopic parameters), green ticks (shown as green squares on the left panel), and grey ticks (not shown on the left panel). Purple × indicates HD 133729 on all panels. There are some markers on both panels to indicate special evolutionary points, and the same markers on the left and right panels are for the same point. Δ indicates the starts of stable SHeB, and □ indicates where are the maximum radius of SHeB phases. So SHeB sdBs evolve from Δ to □. When the core masses are small (0.45 or 0.5 M⊙), the SHeB sdBs expand to □ and then shrink to WD (Δ → □ → outside); when the core masses are large (0.75 or 1.0 M⊙), the SHeB sdBs directly expand to giant branch (Δ → outside). The arrows on right panels also indicate the evolutionary direction. We note that the r-axis on Part B applies symlog (symmetrical log) scale, which allows positive and negative values by setting a range around zero within the plot to be linear instead of logarithmic.
Current usage metrics show cumulative count of Article Views (full-text article views including HTML views, PDF and ePub downloads, according to the available data) and Abstracts Views on Vision4Press platform.
Data correspond to usage on the plateform after 2015. The current usage metrics is available 48-96 hours after online publication and is updated daily on week days.
Initial download of the metrics may take a while.