Fig. 9
Download original image
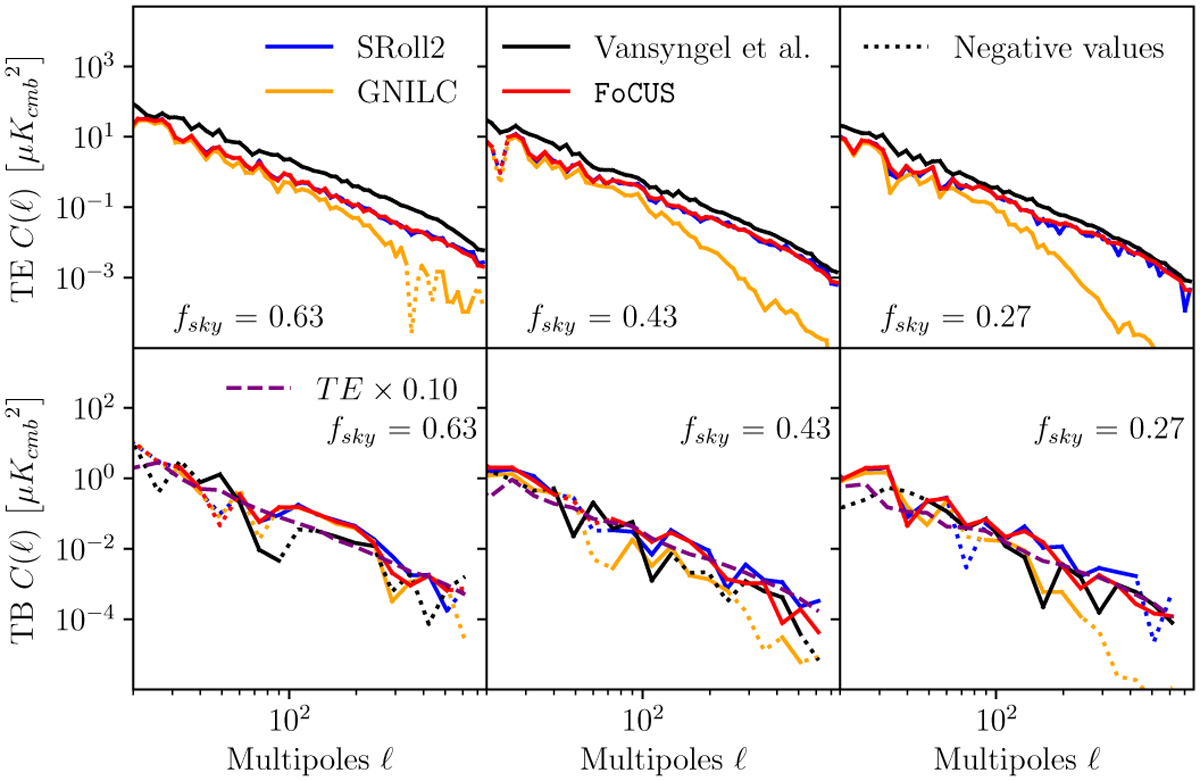
T E (top row) and TB (bottom row) cross-power spectra of the SRoll2 (blue curves) and FoCUS maps (red curves). The orange and black curves show the same results for the GNILC and Vansyngel maps. Each column corresponds to a different galactic mask. The cross-power spectra are binned in bins of width ![]() for T E and 0.2 for T B to reduce the noise variance. Dotted lines represent negative values.
for T E and 0.2 for T B to reduce the noise variance. Dotted lines represent negative values.
Current usage metrics show cumulative count of Article Views (full-text article views including HTML views, PDF and ePub downloads, according to the available data) and Abstracts Views on Vision4Press platform.
Data correspond to usage on the plateform after 2015. The current usage metrics is available 48-96 hours after online publication and is updated daily on week days.
Initial download of the metrics may take a while.