Fig. 8
Download original image
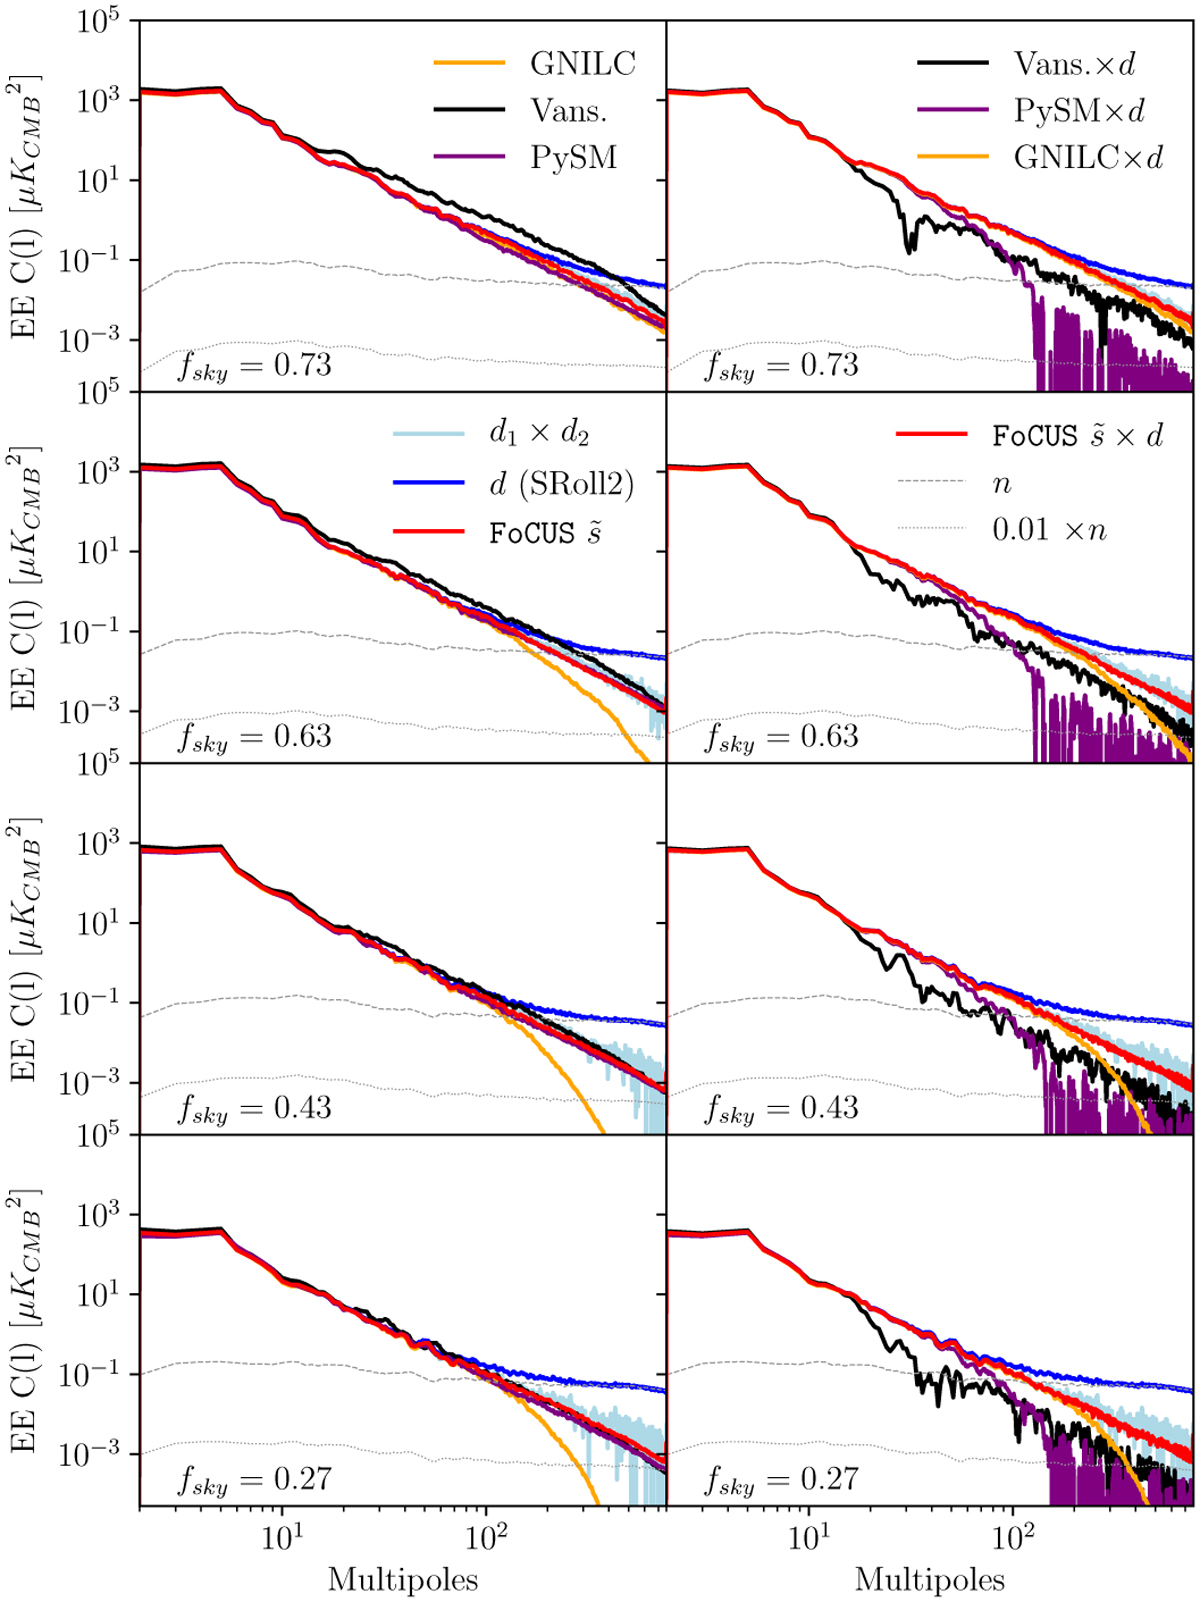
EE power spectra (left column) and cross-power spectra (right column) for Galactic masks with fsky=0.27 (bottom) to 0.73 (top). In each plot, the cross spectrum of the two Planck half-mission maps is drawn in purple. The blue, orange, and red curves represent the power spectra of the SRoll2, GNILC, and FoCUS maps, respectively. All the spectra are binned over ten multipoles and normalized by dividing the power with the fsky value to keep the scales consistent between the plots.
Current usage metrics show cumulative count of Article Views (full-text article views including HTML views, PDF and ePub downloads, according to the available data) and Abstracts Views on Vision4Press platform.
Data correspond to usage on the plateform after 2015. The current usage metrics is available 48-96 hours after online publication and is updated daily on week days.
Initial download of the metrics may take a while.