Fig. 5
Download original image
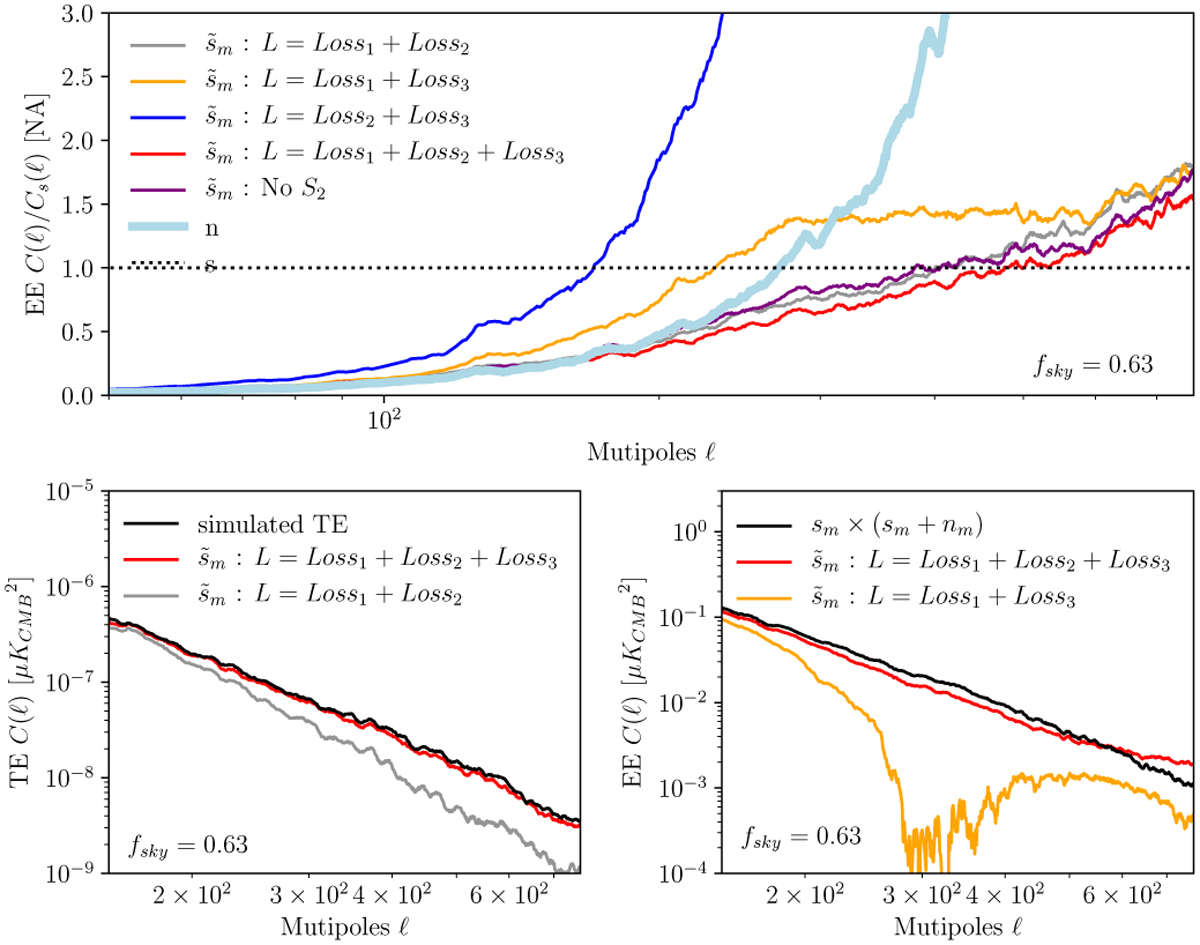
Power spectra of the FoCUS maps for different combinations of the three loss terms Loss1; Loss2, and Loss3. Top plot: ratio of the EE spectra of the residual map, ![]() , and the input dust model sm. Bottom left plot: compares the TE spectra obtained with or without Loss3, in red and grey, respectively. Bottom right plot: compares the cross spectra between FoCUS map
, and the input dust model sm. Bottom left plot: compares the TE spectra obtained with or without Loss3, in red and grey, respectively. Bottom right plot: compares the cross spectra between FoCUS map ![]() and the mock data d with or without Loss2, in red and yellow, respectively. All of the spectra are binned in ℓ bins with a width ∆ℓ = 10.
and the mock data d with or without Loss2, in red and yellow, respectively. All of the spectra are binned in ℓ bins with a width ∆ℓ = 10.
Current usage metrics show cumulative count of Article Views (full-text article views including HTML views, PDF and ePub downloads, according to the available data) and Abstracts Views on Vision4Press platform.
Data correspond to usage on the plateform after 2015. The current usage metrics is available 48-96 hours after online publication and is updated daily on week days.
Initial download of the metrics may take a while.