Fig. 4
Download original image
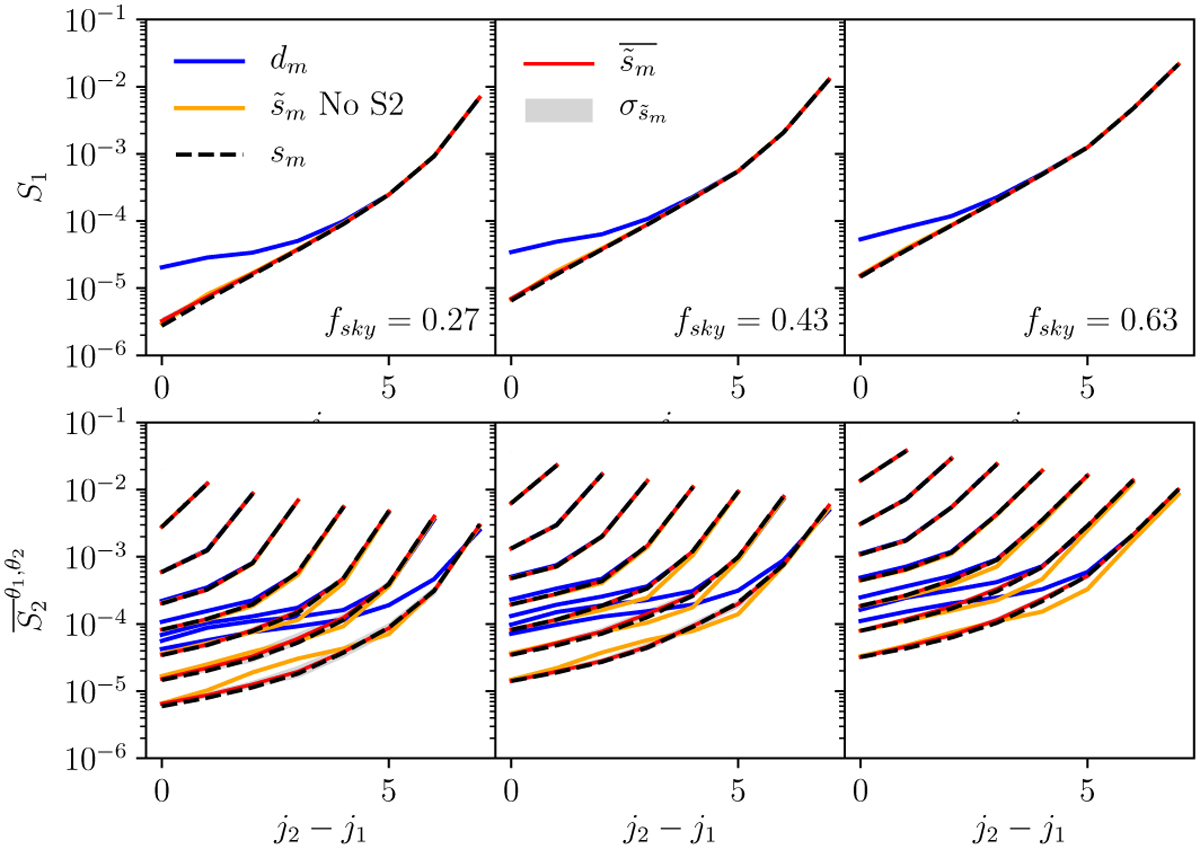
Comparison of CWST statistics. The CWST coefficients of the FoCUS output map ![]() (solid red line) are compared to those of the mock data d (solid blue line) and the noise-free dust model sm (dashed black line). The thicker grey line represents the statistical variance of the FoCUS output estimated from ten simulations. The top row shows the coefficients S1 plotted vs scale j1, and the bottom row shows the S2 coefficients averaged over θ1 and θ2 plotted vs the ratio of the two scales j2 − j1. The three columns correspond to different Galactic masks.
(solid red line) are compared to those of the mock data d (solid blue line) and the noise-free dust model sm (dashed black line). The thicker grey line represents the statistical variance of the FoCUS output estimated from ten simulations. The top row shows the coefficients S1 plotted vs scale j1, and the bottom row shows the S2 coefficients averaged over θ1 and θ2 plotted vs the ratio of the two scales j2 − j1. The three columns correspond to different Galactic masks.
Current usage metrics show cumulative count of Article Views (full-text article views including HTML views, PDF and ePub downloads, according to the available data) and Abstracts Views on Vision4Press platform.
Data correspond to usage on the plateform after 2015. The current usage metrics is available 48-96 hours after online publication and is updated daily on week days.
Initial download of the metrics may take a while.