Fig. 3

Download original image
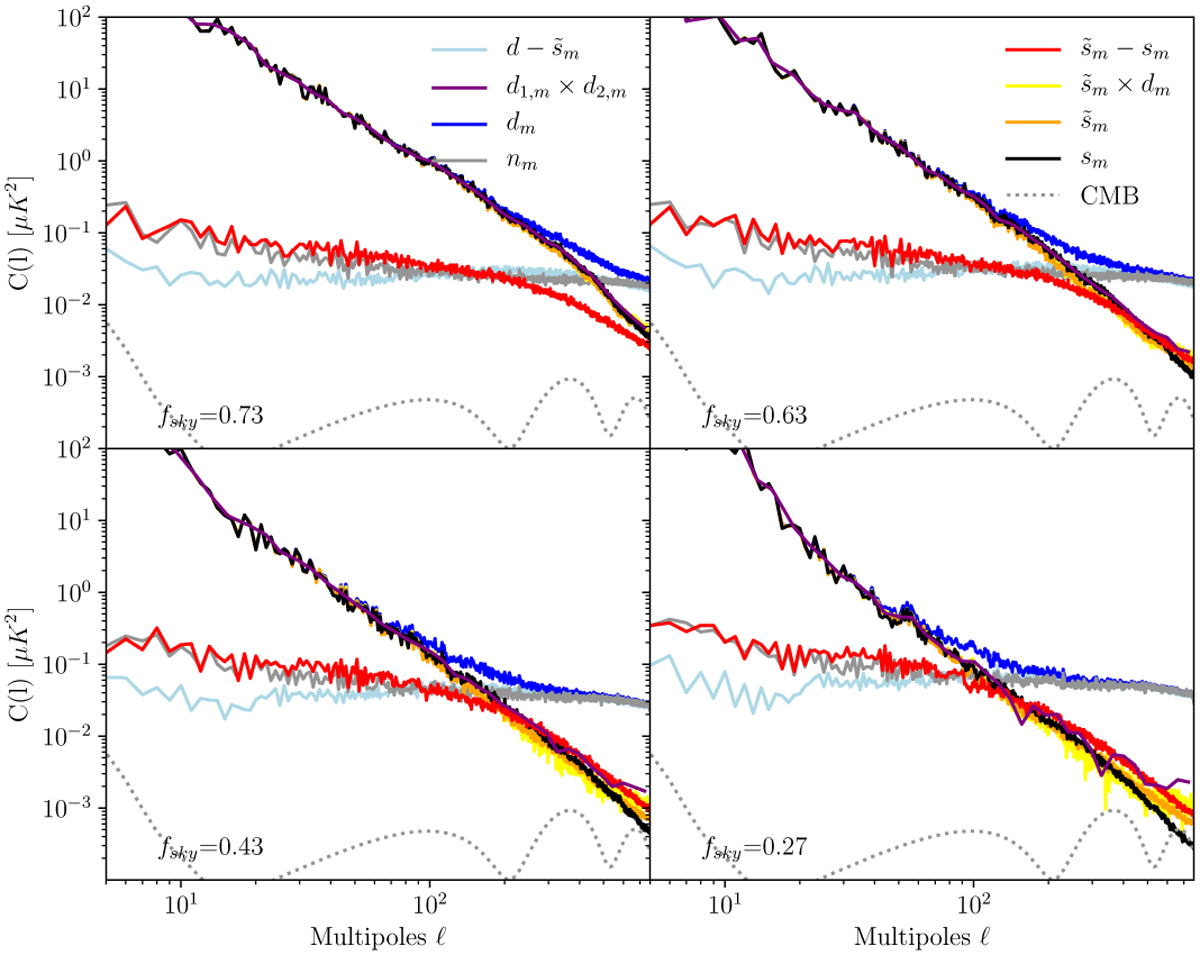
Power spectra of one realisation for the FoCUS validation on mock data. The plots show EE spectra of the dust model (sm in black), the noisy mock data (dm in blue), and the FoCUS output (![]() in orange) for four masks with fsky from 0.27 to 0.73. The red curve is the power spectrum of the residual map
in orange) for four masks with fsky from 0.27 to 0.73. The red curve is the power spectrum of the residual map ![]() . The figure also presents the noise spectrum (nm) and the noise estimate from FoCUS (
. The figure also presents the noise spectrum (nm) and the noise estimate from FoCUS (![]() ), as well as cross spectra between half-mission mock maps (d1,m × d2,m logarithmic binned) and between
), as well as cross spectra between half-mission mock maps (d1,m × d2,m logarithmic binned) and between ![]() and dm. Other mock data realisations show very consistent power spectra.
and dm. Other mock data realisations show very consistent power spectra.
Current usage metrics show cumulative count of Article Views (full-text article views including HTML views, PDF and ePub downloads, according to the available data) and Abstracts Views on Vision4Press platform.
Data correspond to usage on the plateform after 2015. The current usage metrics is available 48-96 hours after online publication and is updated daily on week days.
Initial download of the metrics may take a while.


