Fig. 11
Download original image
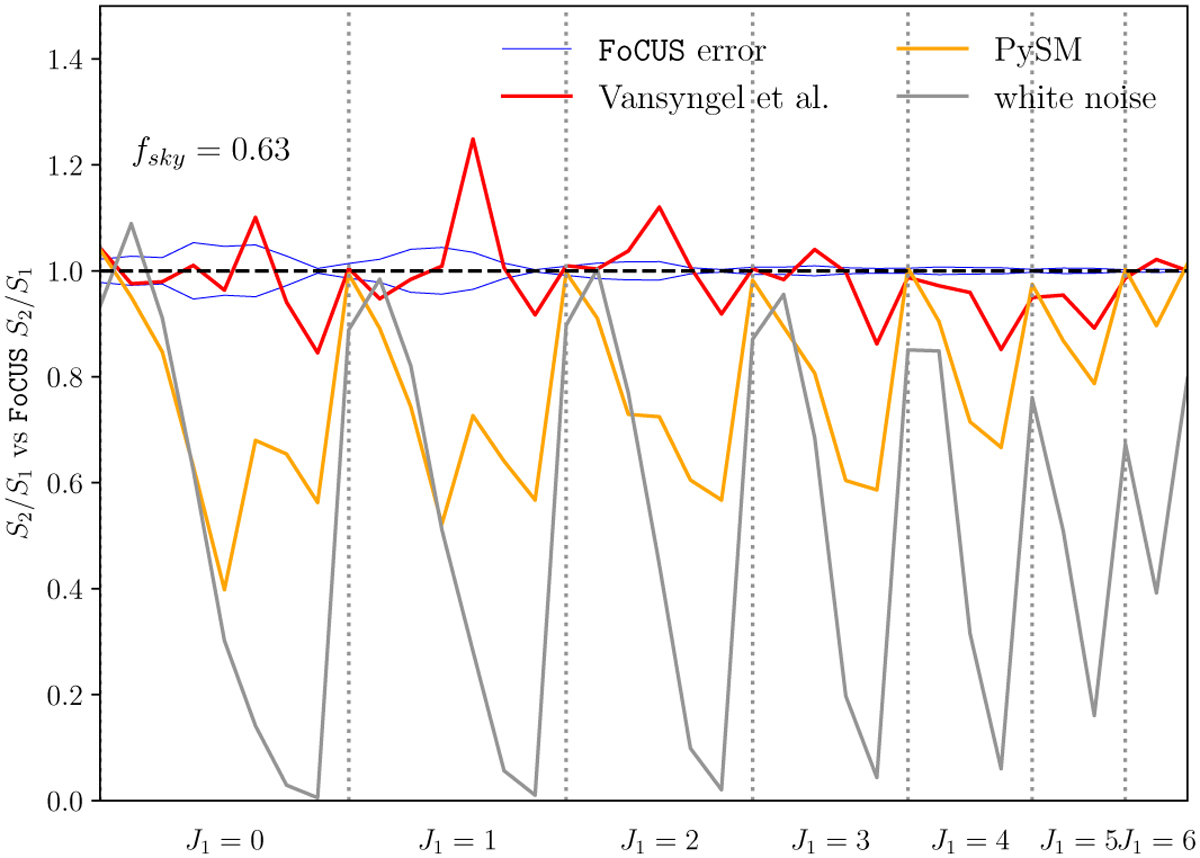
Comparison of the second-order S2 CWST coefficients used as a measure of non-Gaussianity. The S2 coefficients of E maps normalized by S1 are plotted vs scales J1 and J2. The data are ordered by J1 values and for each J1 for increasing J2. The plot compares S2/S1 ratios for a Gaussian map in purple, the PySM model in yellow, and the model of Vansyngel et al. (2017) and the FoCUS map with a dashed black line. All data values are normalised by those of the FoCUS map. The two blue curves shows the uncertainty (±1σ) on the S2/S1 ratio estimated from simulations.
Current usage metrics show cumulative count of Article Views (full-text article views including HTML views, PDF and ePub downloads, according to the available data) and Abstracts Views on Vision4Press platform.
Data correspond to usage on the plateform after 2015. The current usage metrics is available 48-96 hours after online publication and is updated daily on week days.
Initial download of the metrics may take a while.