Fig. 8
Download original image
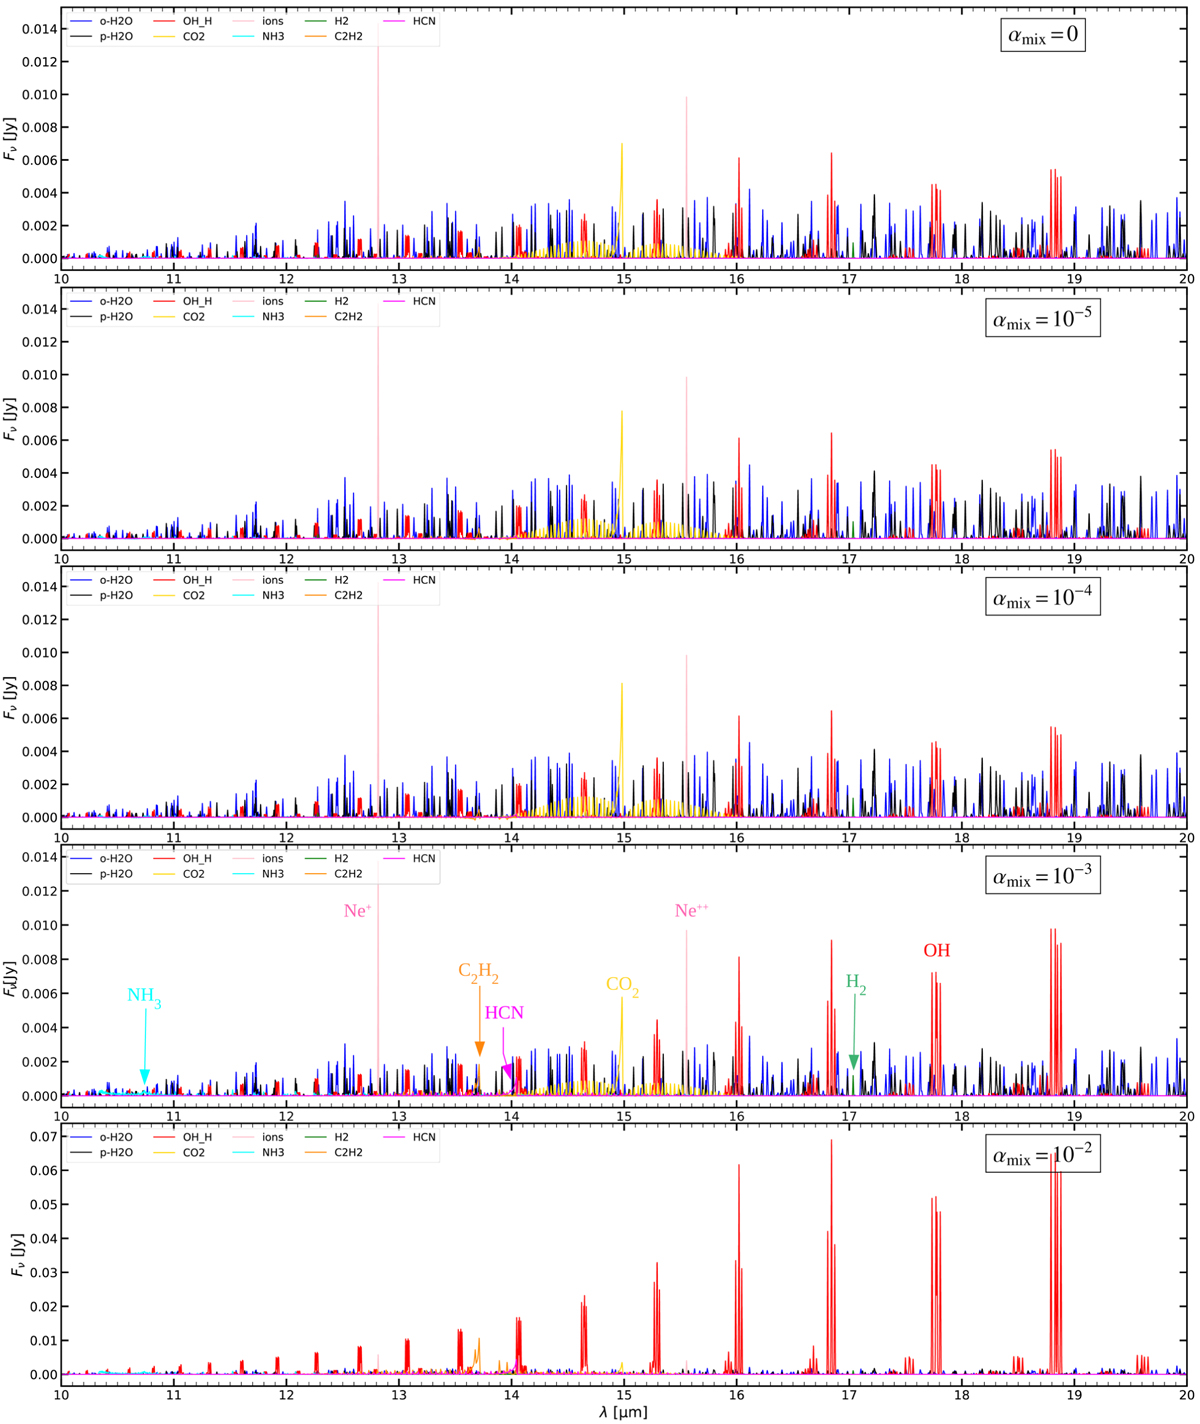
Fig. 8 ~ Continuum-subtracted infrared line emission spectra for a disc inclination of 45° and spectral resolution R = 3000 with varying mixing parameter αmix. It is important to note the different scaling of the y-axis. Most visible spectral features are overlapping o-H2O (blue) and p-H2O (black) emission lines. A few other features emitted from other molecules and ions are annotated in one of the plots. Each molecular spectrum is first convolved with a Gaussian R = 3000 and then overplotted with a certain colour, but not co-added.
Current usage metrics show cumulative count of Article Views (full-text article views including HTML views, PDF and ePub downloads, according to the available data) and Abstracts Views on Vision4Press platform.
Data correspond to usage on the plateform after 2015. The current usage metrics is available 48-96 hours after online publication and is updated daily on week days.
Initial download of the metrics may take a while.