Fig. 6
Download original image
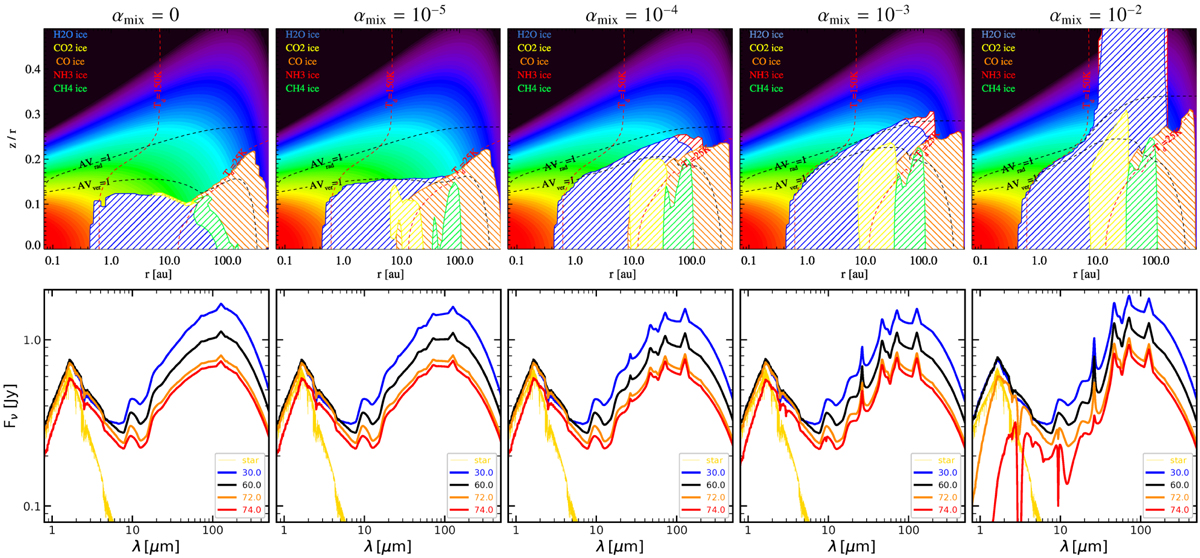
Upper row of plots shows the location of the ices, in a series of models with increasing mixing parameter αmix. The icy regions are hashed when the respective ice concentration, for example nH2O#/n〈H〉 for water ice, is larger than 10−55. The background colours show the hydrogen nuclei density n〈H〉 from 102 cm−3 (black) to 1016 cm−3 (red). The dashed black contour lines show the radial visual extinction AV,rad = 1 and vertical visual extinction AV,ver = 1, and the red dashed lines show two dust temperature contours, 25 K and 150 K. The lower row of plots shows the respective SEDs for selected inclination angles at a distance of 140 pc. The yellow lines indicate the adopted photospheric spectrum of the naked star. We note that the absorption feature around 2.5 µm is due to molecular absorption in the stellar photosphere, whereas all other narrow absorption and emission features are due to ices, except for the broad 10 µm/20 µm silicate emission features.
Current usage metrics show cumulative count of Article Views (full-text article views including HTML views, PDF and ePub downloads, according to the available data) and Abstracts Views on Vision4Press platform.
Data correspond to usage on the plateform after 2015. The current usage metrics is available 48-96 hours after online publication and is updated daily on week days.
Initial download of the metrics may take a while.