Fig. 5
Download original image
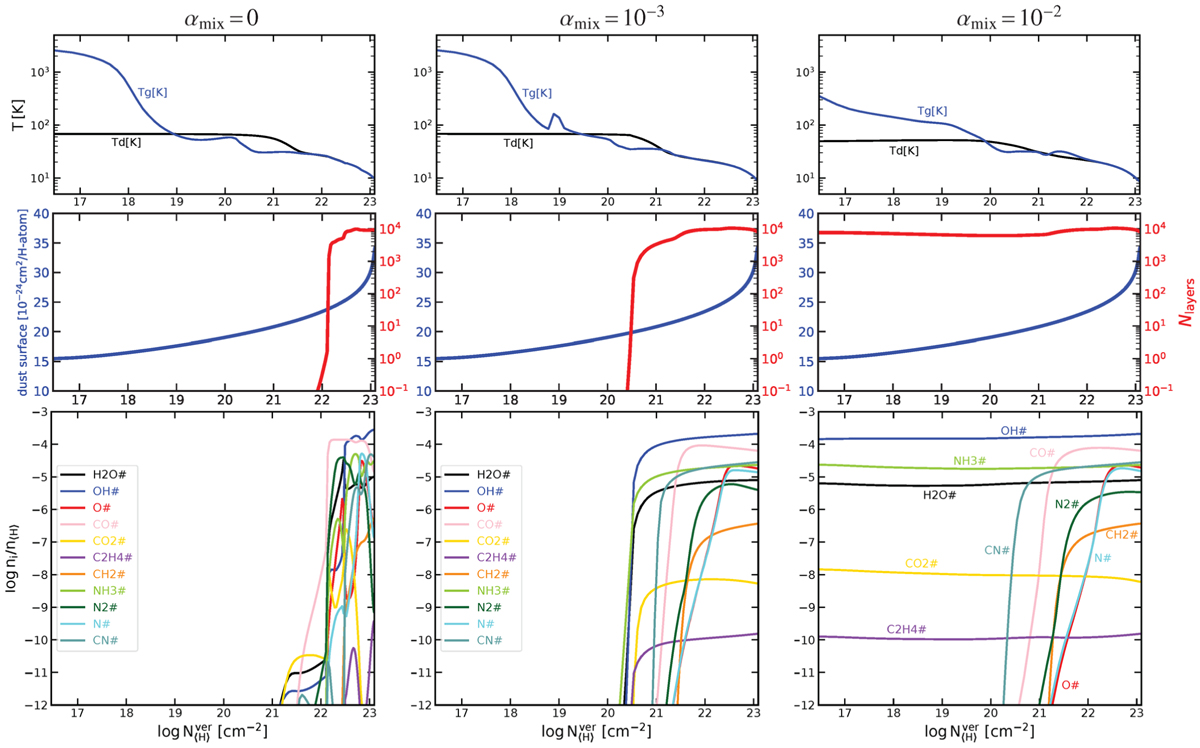
Vertical spreading of icy grains at r = 100 au for different mixing strengths αmix. Results are shown as a function of the vertical hydrogen nuclei column density N〈H〉. The top row of plots shows the computed gas and dust temperatures, Tg and Td. The middle row of plots shows the bare grain surface area per H nucleus = 4π〈a2〉nd/n〈H〉 after dust settling in blue, and the number of ice layers on each grain Nlayers in red. The lower plots show the concentrations of selected ice species.
Current usage metrics show cumulative count of Article Views (full-text article views including HTML views, PDF and ePub downloads, according to the available data) and Abstracts Views on Vision4Press platform.
Data correspond to usage on the plateform after 2015. The current usage metrics is available 48-96 hours after online publication and is updated daily on week days.
Initial download of the metrics may take a while.