Fig. 4
Download original image
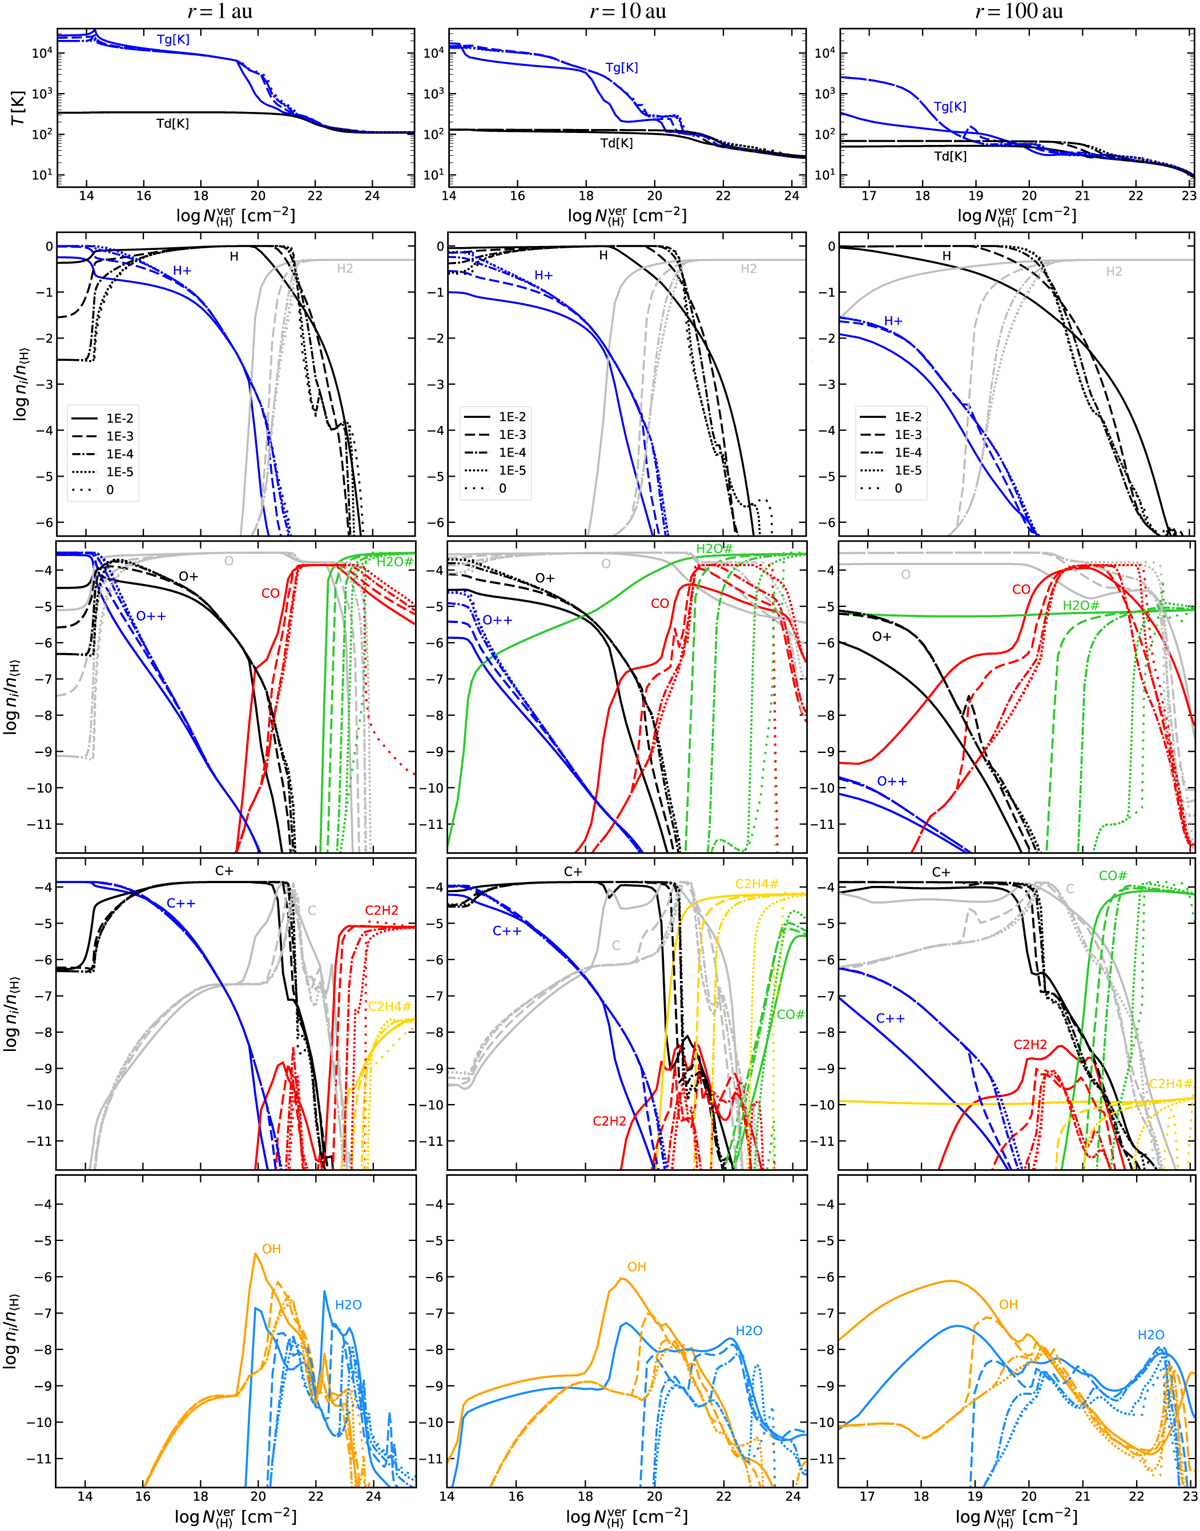
Resulting temperatures and chemical concentrations as a function of vertical hydrogen column density N〈H〉, for radial distances 1 au, 10 au, and 100 au, from left to right. The top row shows the gas and dust temperatures, the second row the main hydrogen species, the third row the oxygen chemistry, and the last row the carbon chemistry. Only a few selected species are plotted. In each part of the figure, the various dashed and dotted lines correspond to the mixing parameter αmix, as explained in the legends.
Current usage metrics show cumulative count of Article Views (full-text article views including HTML views, PDF and ePub downloads, according to the available data) and Abstracts Views on Vision4Press platform.
Data correspond to usage on the plateform after 2015. The current usage metrics is available 48-96 hours after online publication and is updated daily on week days.
Initial download of the metrics may take a while.