Fig. 3
Download original image
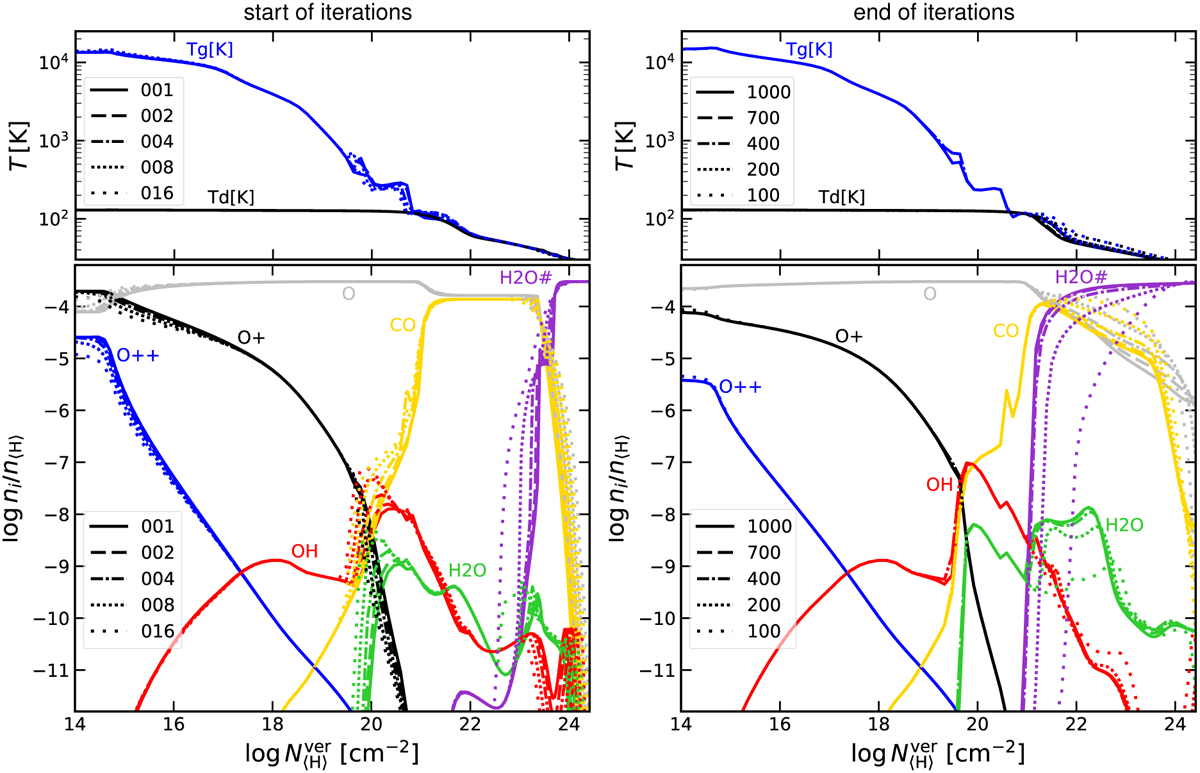
Monitoring the convergence of the iterative solution method along a vertical cut at r = 10 au as a function of the vertical hydrogen nuclei column density ![]() for the model with medium strong mixing, αmix = 10−3. The upper plots show the changing gas and dust temperature as a function of iteration number. The lower plots shows the concentrations of a few selected oxygen-bearing gas and ice species. The left row shows the first few iterations and the right row shows the convergence towards iteration 1000, which is considered as the final solution. The different full, dashed and dotted lines correspond to the different numbers of iterations carried out as indicated.
for the model with medium strong mixing, αmix = 10−3. The upper plots show the changing gas and dust temperature as a function of iteration number. The lower plots shows the concentrations of a few selected oxygen-bearing gas and ice species. The left row shows the first few iterations and the right row shows the convergence towards iteration 1000, which is considered as the final solution. The different full, dashed and dotted lines correspond to the different numbers of iterations carried out as indicated.
Current usage metrics show cumulative count of Article Views (full-text article views including HTML views, PDF and ePub downloads, according to the available data) and Abstracts Views on Vision4Press platform.
Data correspond to usage on the plateform after 2015. The current usage metrics is available 48-96 hours after online publication and is updated daily on week days.
Initial download of the metrics may take a while.