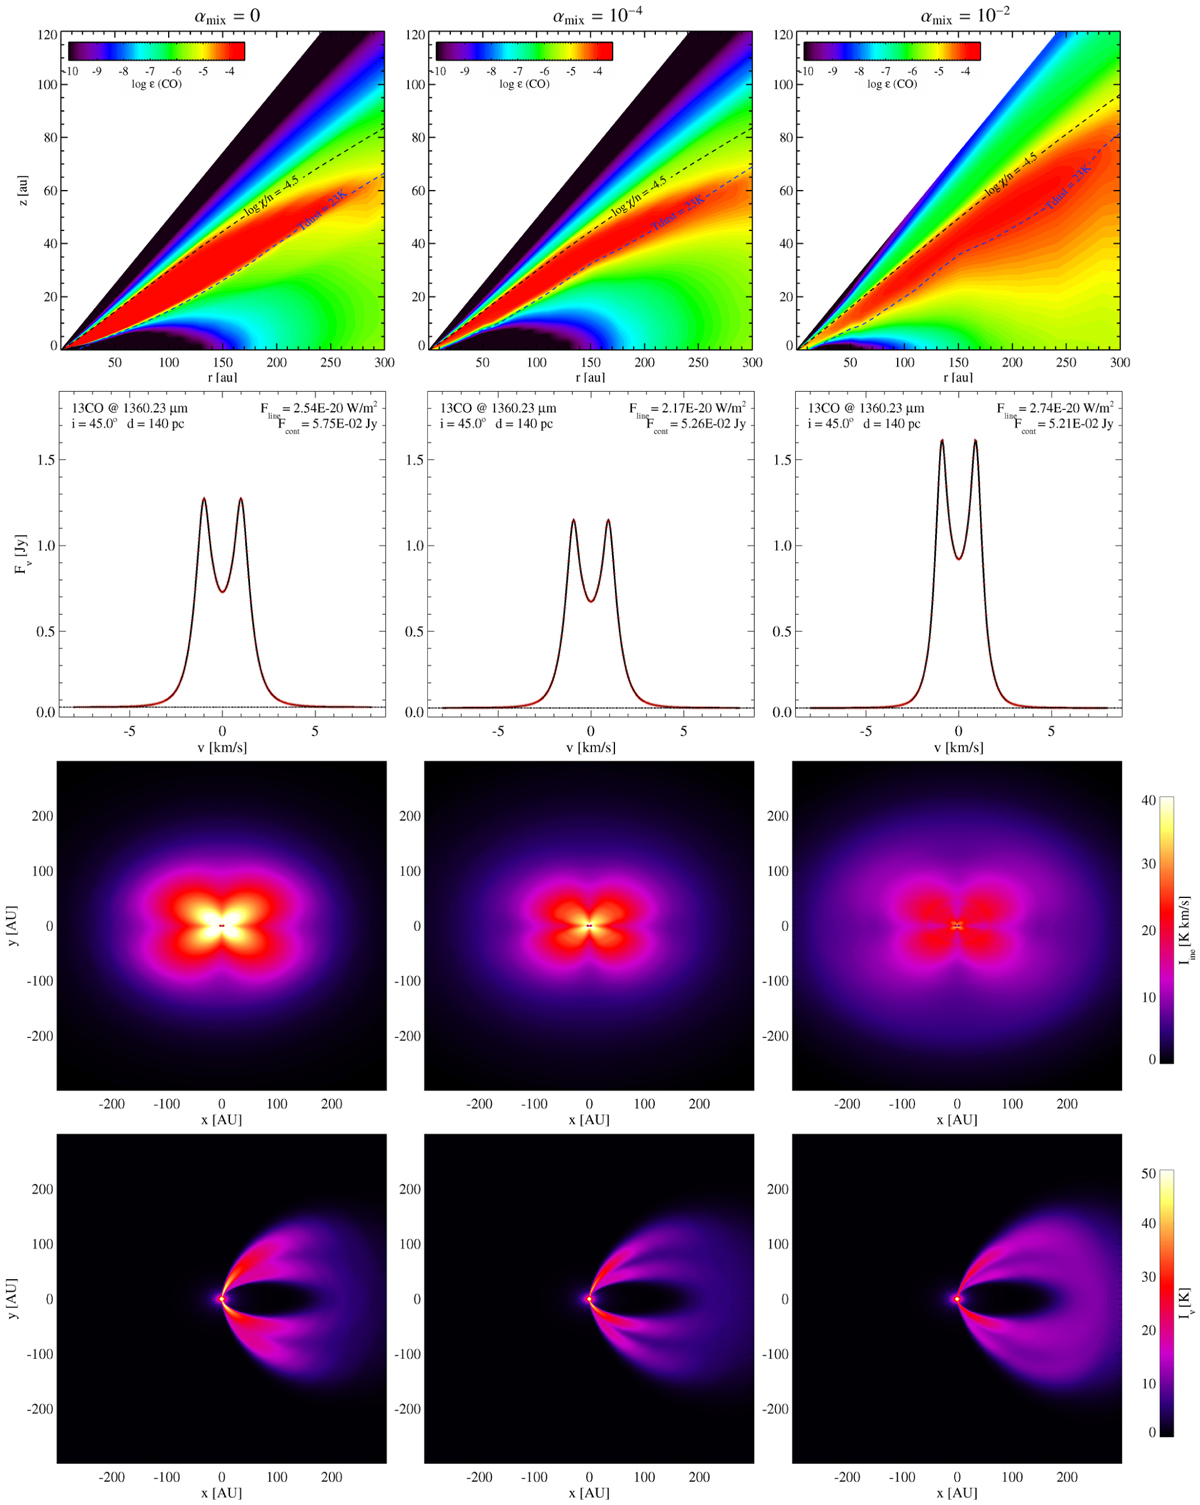
Fig. 11
Download original image
Influence of vertical mixing on millimetre CO observations. The top row shows the CO concentration є(CO) = nCO/n〈H〉 in the disc on linear scales for radius r and vertical height z. The two dashed contour lines enclose the region of maximum CO concentration, where χ is the UV strength and n = n〈H〉 is the total hydrogen nuclei particle density. Below dust temperature Tdust ≈ 23 K, CO is mostly frozen. The second row shows the 13CO J= 2 → 1 line velocity profile observed from a distance of 140 pc at a disc inclination of 45°. The third row shows the integrated line map after continuum subtraction and the bottom row shows a channel map at radial velocity v + 0.94 km s−1. To plot the intensities in Kelvin, we consider Iv c2/(2v2)/k, where Iv [erg cm−2 s−1 Hz−1 sr−1] is the spectral intensity, c the speed of light, v the frequency, and k the Boltzmann constant.
Current usage metrics show cumulative count of Article Views (full-text article views including HTML views, PDF and ePub downloads, according to the available data) and Abstracts Views on Vision4Press platform.
Data correspond to usage on the plateform after 2015. The current usage metrics is available 48-96 hours after online publication and is updated daily on week days.
Initial download of the metrics may take a while.