Fig. 1
Download original image
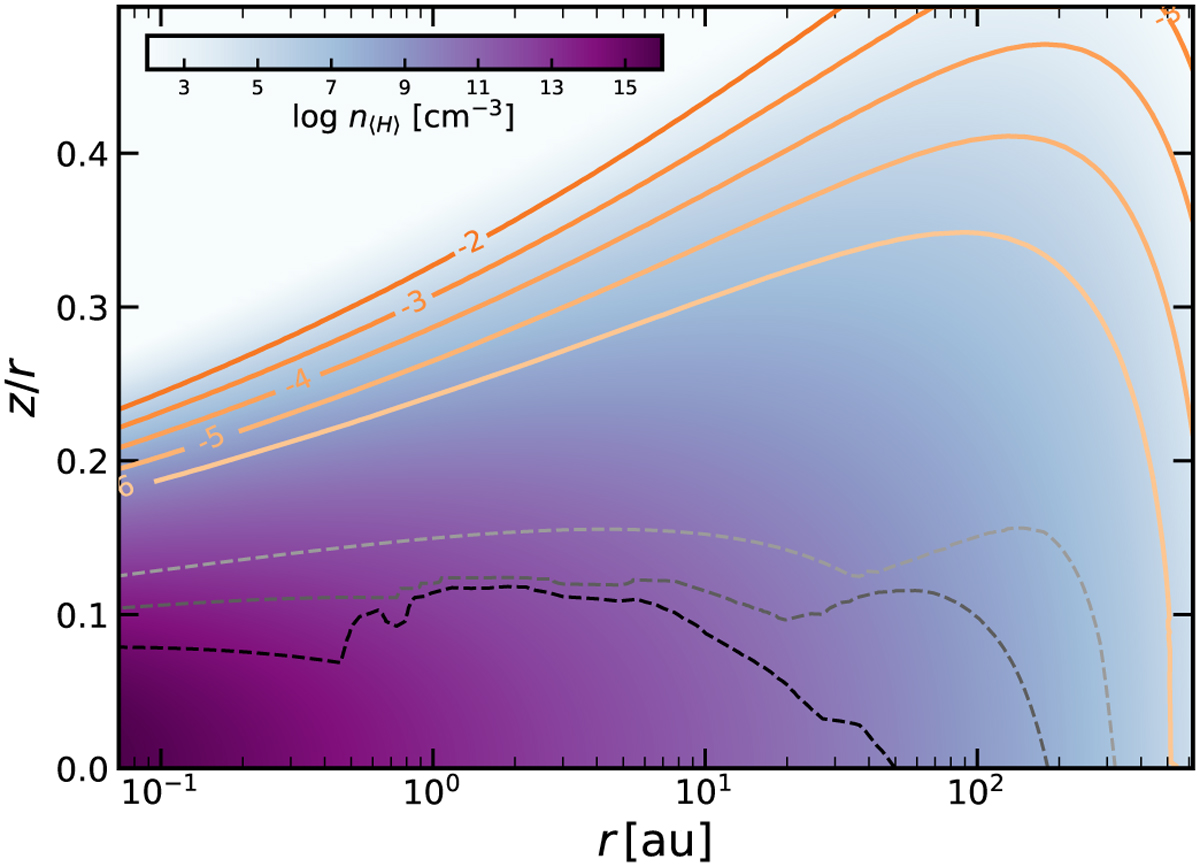
Location of the homopause, where the diffusion coefficients caused by eddy mixing and gas-kinetic motions are equal (K=Di). The colours show the hydrogen nuclei density, n〈H〉, as a function of radius r and relative height z/r. The coloured contour lines show where the homopause is situated when K is calculated with different values of log10 αmix. The dashed lines show where the vertical optical extinction AV,ver equals 100 (black), ten (dark grey) and one (light grey). The dust opacities correspond to our un-mixed model described in Sect. 3. The uneven AV contours are caused by the uneven spatial distribution of the ices, which are taken into account when calculating the opacities.
Current usage metrics show cumulative count of Article Views (full-text article views including HTML views, PDF and ePub downloads, according to the available data) and Abstracts Views on Vision4Press platform.
Data correspond to usage on the plateform after 2015. The current usage metrics is available 48-96 hours after online publication and is updated daily on week days.
Initial download of the metrics may take a while.