Fig. 9
Download original image
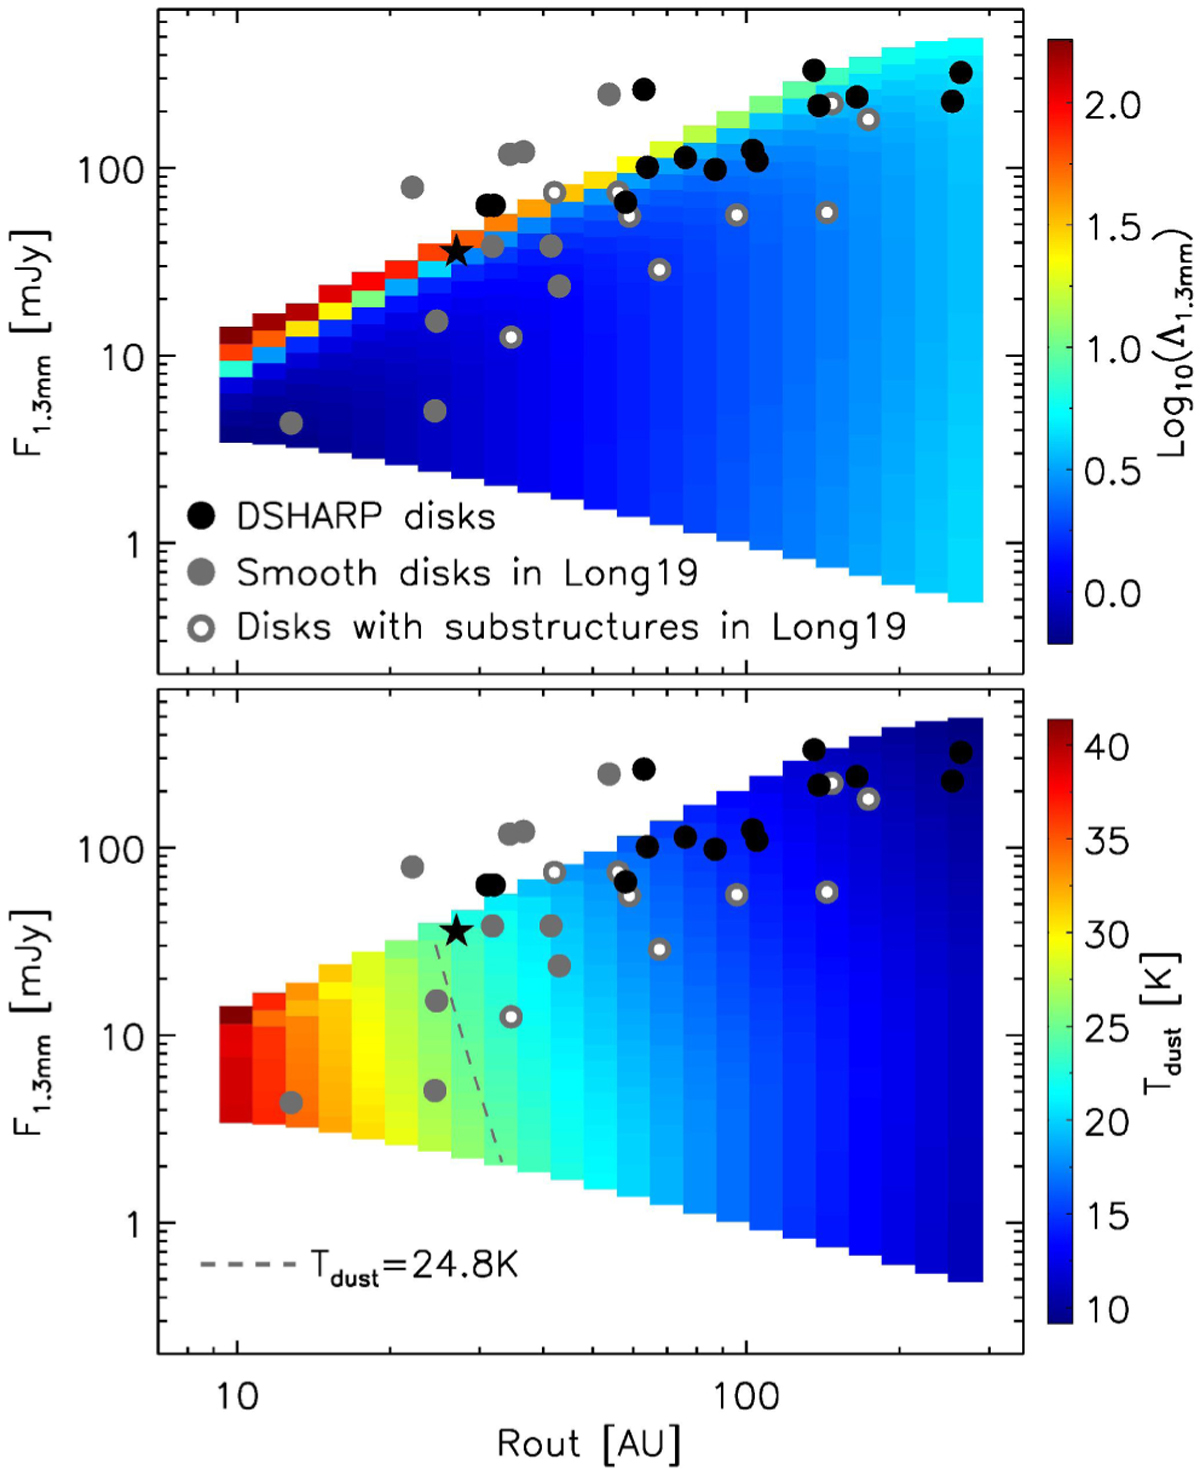
Distribution of the underestimation factor and dust temperature in the parameter space of {F1.3 mm, Rout}. Upper panel: Λ1.3 mm asafunction of F1.3 mm and Rout. Black dots stand for the DSHARP disks. The black star represents the DoAr 33 disk. Smooth disks and disks with substructures observed in Long et al. (2019) are indicated with gray dots and gray rings, respectively. All the flux densities are scaled to the distance of 140 pc. Bottom panel: Tdust as a function of F1.3 mm and Rout. The dashed line draws the contour level of 24.8 K, which is the analytic temperature simply given by 25 (L⋆/L⊙)0.25 K.
Current usage metrics show cumulative count of Article Views (full-text article views including HTML views, PDF and ePub downloads, according to the available data) and Abstracts Views on Vision4Press platform.
Data correspond to usage on the plateform after 2015. The current usage metrics is available 48-96 hours after online publication and is updated daily on week days.
Initial download of the metrics may take a while.