Fig. 8
Download original image
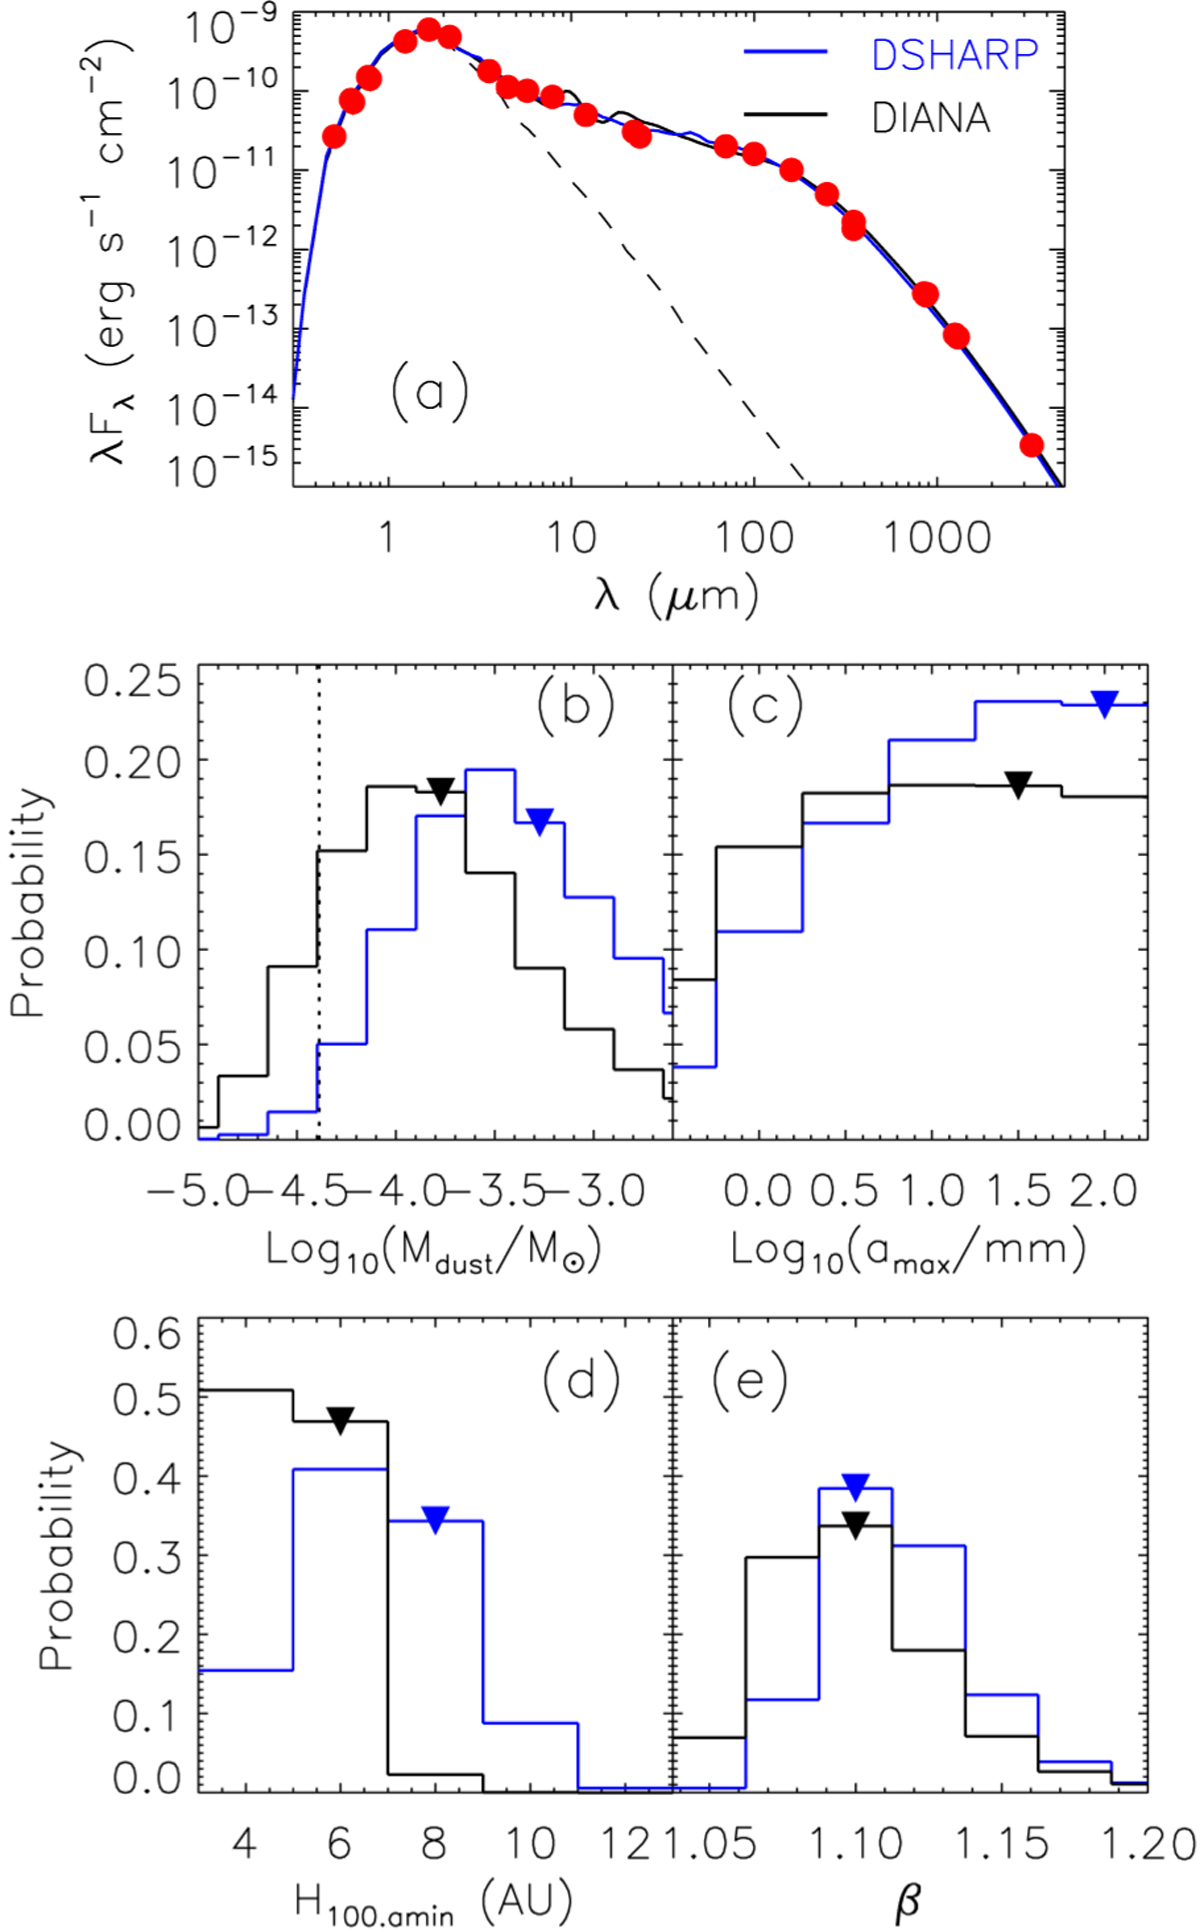
Fitting results of the DoAr 33 disk. Panel a: SEDs of DoAr 33. The best-fit radiative transfer models using the DSHARP and DIANA opacities are shown with solid blue and black lines, respectively. The dashed line refers to the input photospheric spectrum, and observational data points are overlaid with red dots. Panels b–e: Bayesian probability distributions for Log10(Mdust/M⊙), Log10(amax/mm), ![]() and β The triangles indicate the parameter values of the best-fit radiative transfer model. The vertical dotted line in panel b marks the analytic dust mass Mdust.ana that was derived by using the flux density measured at 1.3 mm, Tdust = 24.8 K, and κ1.3 mm = 2.3 cm2 g−1; see Sect. 4.3.
and β The triangles indicate the parameter values of the best-fit radiative transfer model. The vertical dotted line in panel b marks the analytic dust mass Mdust.ana that was derived by using the flux density measured at 1.3 mm, Tdust = 24.8 K, and κ1.3 mm = 2.3 cm2 g−1; see Sect. 4.3.
Current usage metrics show cumulative count of Article Views (full-text article views including HTML views, PDF and ePub downloads, according to the available data) and Abstracts Views on Vision4Press platform.
Data correspond to usage on the plateform after 2015. The current usage metrics is available 48-96 hours after online publication and is updated daily on week days.
Initial download of the metrics may take a while.