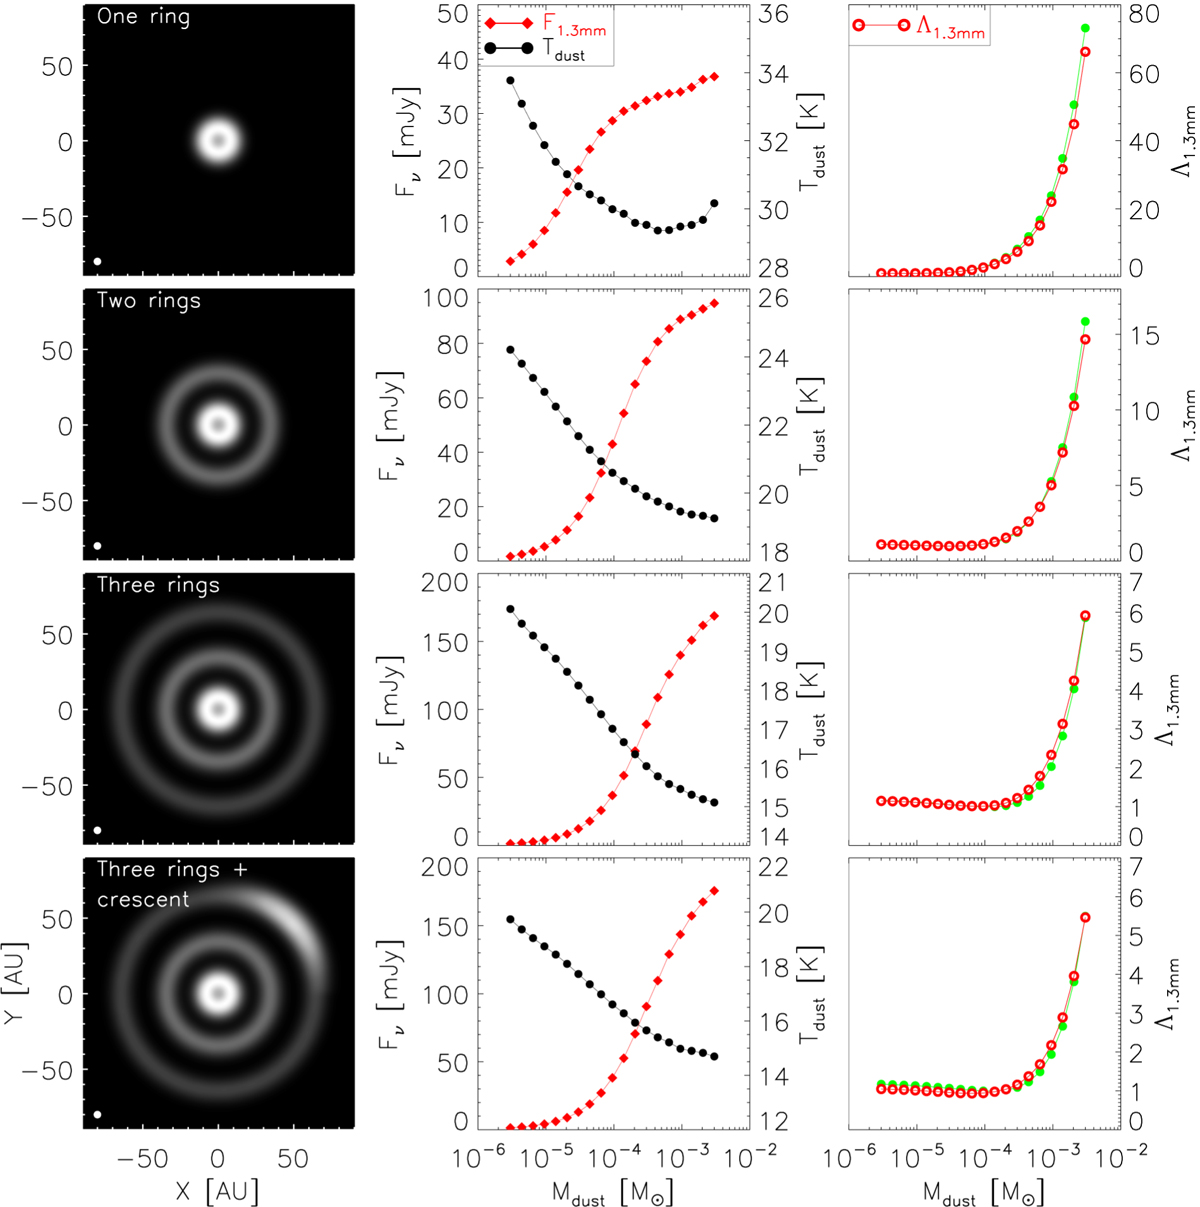
Fig. 7
Download original image
Effects of disk substructures on the mass underestimation. Left column: representative 1.3 mm dust continuum image for each scenario of disk substructures. The raw radiative transfer images are convolved with a Gaussian beam of 35 mas in size (~ 5 AU at the distance of 140 pc, indicated with the filled white circle in the lower left corner of each image). The disk is seen face-on merely for a better presentation of the disk configuration. Middle column: 1.3 mm flux density (F1.3 mm) and mass-averaged temperature (Tdust) as a function of total dust mass (Mdust). When we simulated the SED, the fiducial inclination of 41.8° was adopted. Right column: underestimation factor as a function of Mdust. The green filled circles refer to the underestimation factors for smooth disks that have an equivalent Rout to that of the disks with substructures; see Sect. 3.5.
Current usage metrics show cumulative count of Article Views (full-text article views including HTML views, PDF and ePub downloads, according to the available data) and Abstracts Views on Vision4Press platform.
Data correspond to usage on the plateform after 2015. The current usage metrics is available 48-96 hours after online publication and is updated daily on week days.
Initial download of the metrics may take a while.