Fig. 4
Download original image
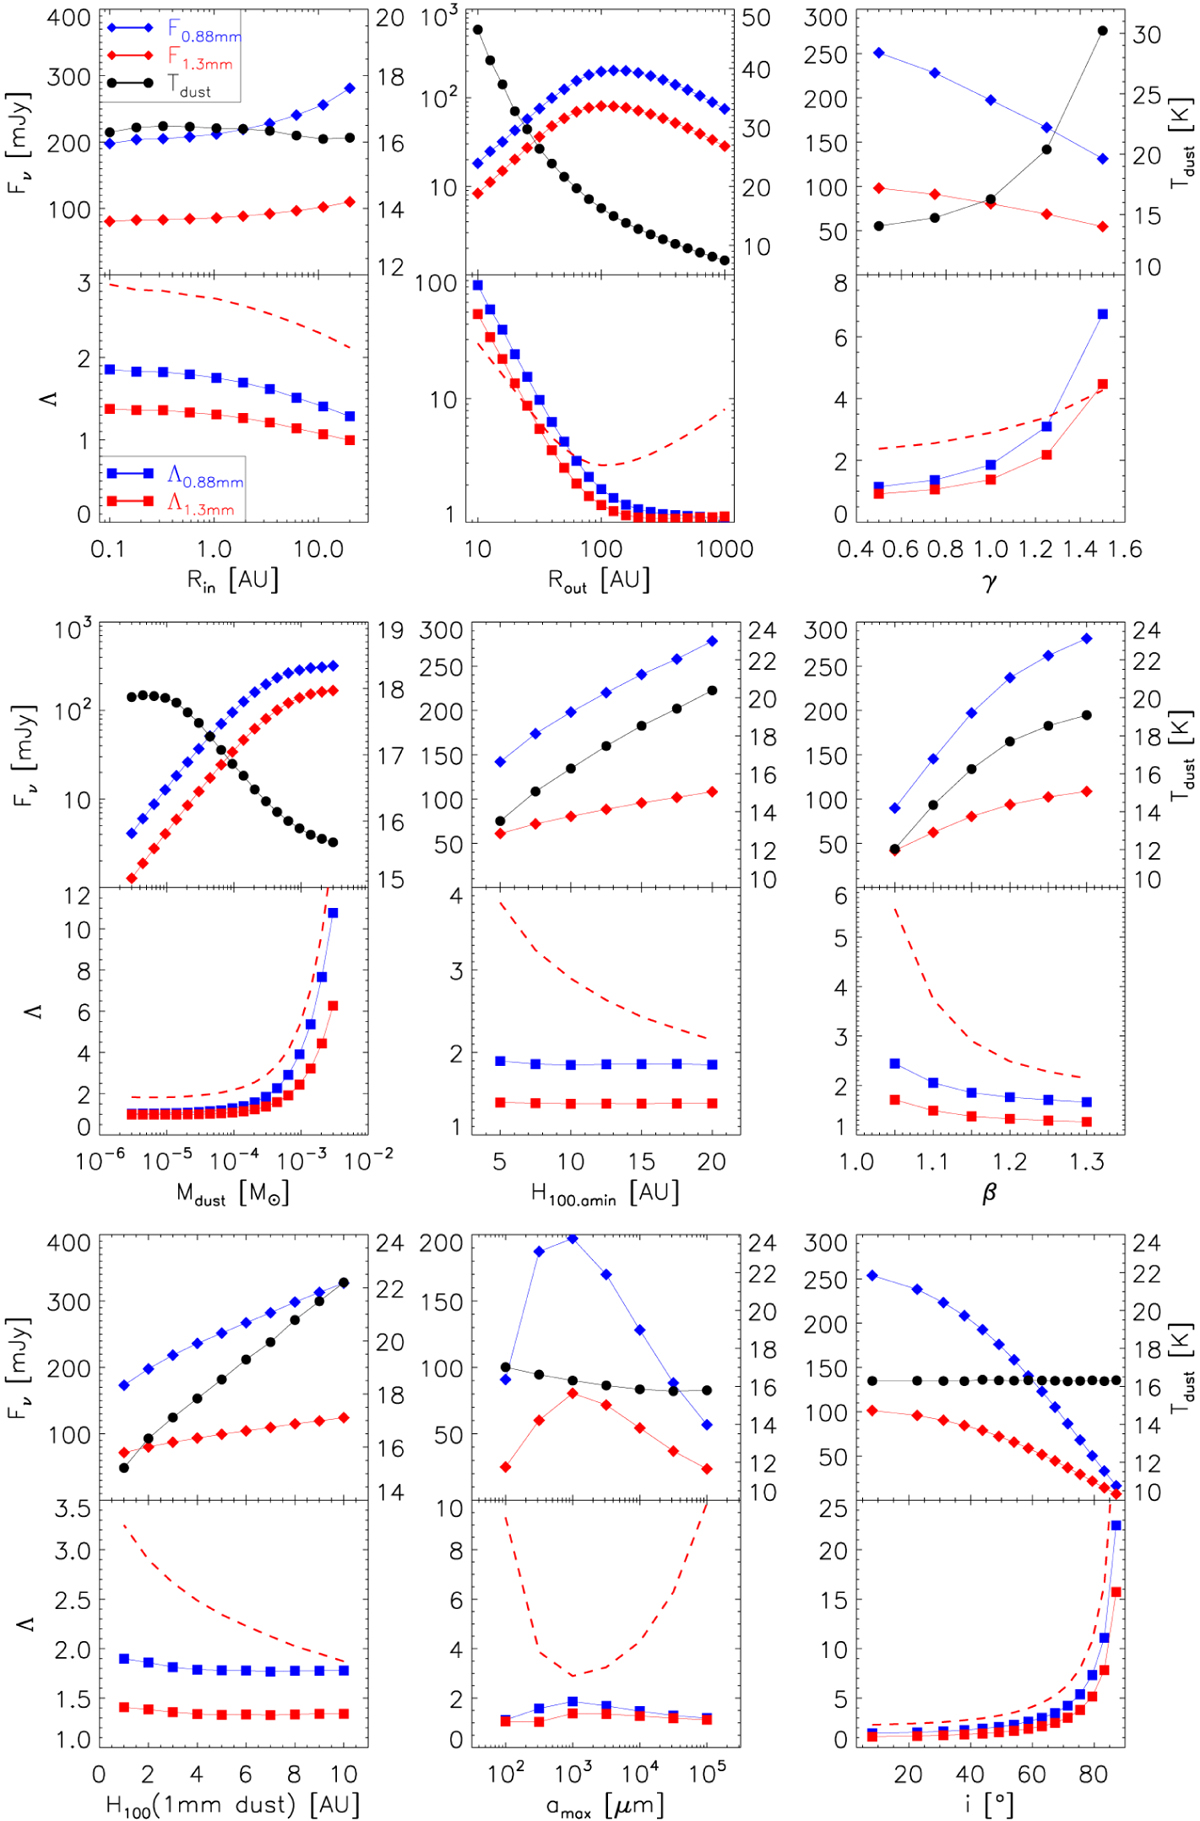
Effects of model parameters on the results. Top row: flux densities at 0.88 and 1.3 mm (F0.88 mm and F1.3 mm, on the left Y-axis) and mass-averaged dust temperature (Tdust, on the right Y-axis) as a function of different model parameters. Bottom row: underestimation factor (Λ0.88 mm and Λ1.3 mm) as a function of different model parameters. When one particular parameter was explored, all the remaining parameters were fixed to their fiducial values listed in Table 1. The red dashed lines show the underestimation factors Λ1.3 mm that were calculated by assuming a constant Tdust = 25 (L⋆/L⊙)0.25 = 24.5 K and κ1.3 mm = 2.3 cm2 g−1.
Current usage metrics show cumulative count of Article Views (full-text article views including HTML views, PDF and ePub downloads, according to the available data) and Abstracts Views on Vision4Press platform.
Data correspond to usage on the plateform after 2015. The current usage metrics is available 48-96 hours after online publication and is updated daily on week days.
Initial download of the metrics may take a while.