Fig. 3
Download original image
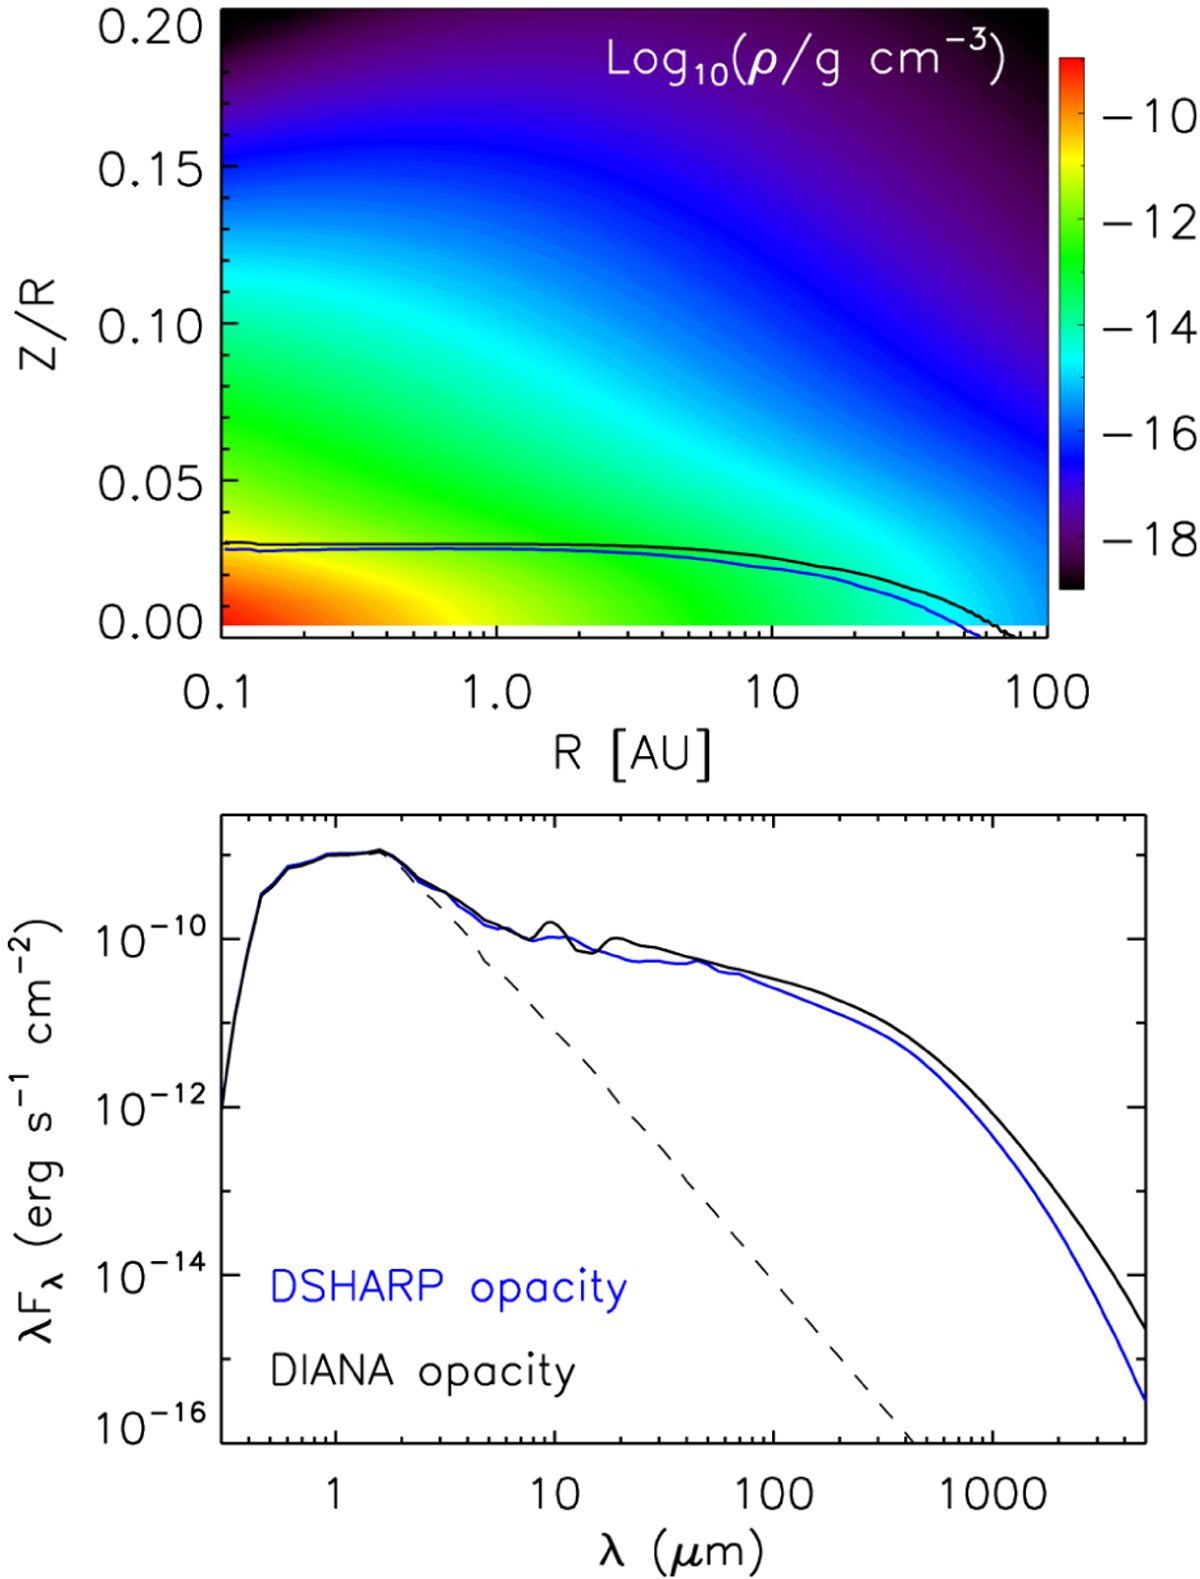
Properties of the fiducial model with parameters given in Table 1. Upper panel: 2D dust density distribution. The blue and black lines draw the contour of τ1.3 mm = 1 when the disk is viewed at i = 41.8°, and the lines include the DSHARP and DIANA dust opacities, respectively. Bottom panel: model SEDs when the DSHARP (blue line) or DIANA (black line) opacities are adopted in the simulation. The dashed curve stands for the input photospheric spectrum with Teff = 4000 K, assuming log g = 3.5 and solar metallicity (Kurucz 1994).
Current usage metrics show cumulative count of Article Views (full-text article views including HTML views, PDF and ePub downloads, according to the available data) and Abstracts Views on Vision4Press platform.
Data correspond to usage on the plateform after 2015. The current usage metrics is available 48-96 hours after online publication and is updated daily on week days.
Initial download of the metrics may take a while.